Updated PCCI Vulnerability Index Highlights Progress, but Ongoing At-Risk Communities

By Thomas Roderick, PCCI’s Executive in Resident
& George “Holt” Oliver, MD, PhD, Vice President, Clinical Informatics

Why this post

More than a year ago, the data scientists at Parkland Center for Clinical Innovation (PCCI) committed to take the fight to COVID-19 by assisting North Texas residents, community leaders and public health officials through delivering actionable pandemic intelligence.

Many of us at PCCI and in the community have suffered the loss of family members, colleagues, coworkers, neighbors and friends. So with great relief we have witnessed tremendous scientific achievements in the development, approval and distribution of COVID-19 vaccines within a year. We have also seen the community evolve and adapt to life with COVID-19 and the actions expand from initial testing strategies to vaccine deployment, herd immunity projections and tracking, to now overcoming vaccination hesitancy and surveillance tracking of emerging variants, re-infections and individual/community immunity.

As our community and pandemic efforts evolve, so does the intelligence it needs. To meet that need, PCCI is evolving its technology and is pleased to announce the next phase of the Vulnerability Index.

What is the Vulnerability Index?

The Vulnerability Index is a measure of risk a community faces due to COVID-19. Higher risk means that people may be more likely to be infected with COVID-19, and if they do, they are more likely to experience symptoms and potentially face hospitalization and even death.

When the Vulnerability Index was first built, it covered factors correlated with COVID-19, including attributes in the community that don’t change quickly (like proportion of elderly population, people living with chronic conditions that are associated with COVID-19, and social determinants of health) as well as dynamic factors that increase immediate risk, like active COVID-19 cases and the mobility of the people living in the community.

How has the Vulnerability Index changed?

The North Texas community has evolved in two very important ways, and so the Vulnerability Index is changing as well.

    • First, as with the rest of the world it has adopted mask-wearing, social distancing, hand washing, and other hygiene and behavioral recommendations from public health authorities to limit the spread of COVID-19. Combined with the full opening of the economy, this means that a mobility factor has less relevance in identifying risk, because people change their behavior when they are out shopping at the grocery store, working, visiting parks, and otherwise engaging in the community. Without these behavior adjustments, mobility would continue to be important to monitor and understand, but not a critical factor in predicting neighborhood vulnerability.
    • Second, the introduction and uptake of the vaccine has started the process of lifting communities to herd immunity (HI), which is where the virus has a hard time finding people to infect because enough people have antibodies. As more people get vaccinated, there are fewer people in the community to become infected, and the community is less vulnerable.

An important caveat is that COVID-19 variants can continue to arise. PCCI is conducting ongoing surveillance on reinfections across Dallas County to assess the emergence of new variants, transmission and potential drop off of previously developed immunity. If this happens it means the mediating effect of the vaccination against COVID-19 risk may be decreased – so more people face infection risk. This is also captured in the updated Vulnerability Index.

How is the Vulnerability Index used?

The Vulnerability Index is used to inform how the communities and municipalities across Dallas County coordinate efforts to improve access to testing, vaccinations and create a path towards herd immunity. Below is a balloon plot, which shows cases on the horizontal axis and vaccinations on the vertical axis. It highlights HI progress in early April for ZIP codes across Dallas County. Each circle represents the current progress; each tail shows the improvement over two weeks. Upward “balloon” trajectory is favorable as it indicates that improvement was a result of vaccinations, not infections.

Source: The Parkland Center for Clinical Innovation

One thing that immediately jumps out is that ZIP codes with higher static vulnerability (or long-term risks in a community that do not change quickly such as age, medical comorbidities and social/economic factors) were slower at vaccine uptake. A potential reason for this is social determinants of health (SDOH) – people who live in these zip codes may be in jobs that are not conducive to have the ability to take time off from work and to travel to vaccine sites to be vaccinated. This information is used by community organizers, public health officials, and health care providers to coordinate efforts and target each community in a way that removes barriers to vaccinations and target information and education via convenient and trusted sources.

Excelsior!

Ongoing vigilance against the virus remains key, and this includes getting vaccinated at your first available opportunity. As we enter the second summer in the pandemic, we at PCCI are committed to monitoring for COVID-19’s continued impact on the community, whether through improving the view into impacted communities, the impact of variants, reinfection risk, and more.

For more information about how PCCI has taken the fight to COVID-19, go to: https://pcci1.wpengine.com/taking-the-fight-to-covid-19/

###

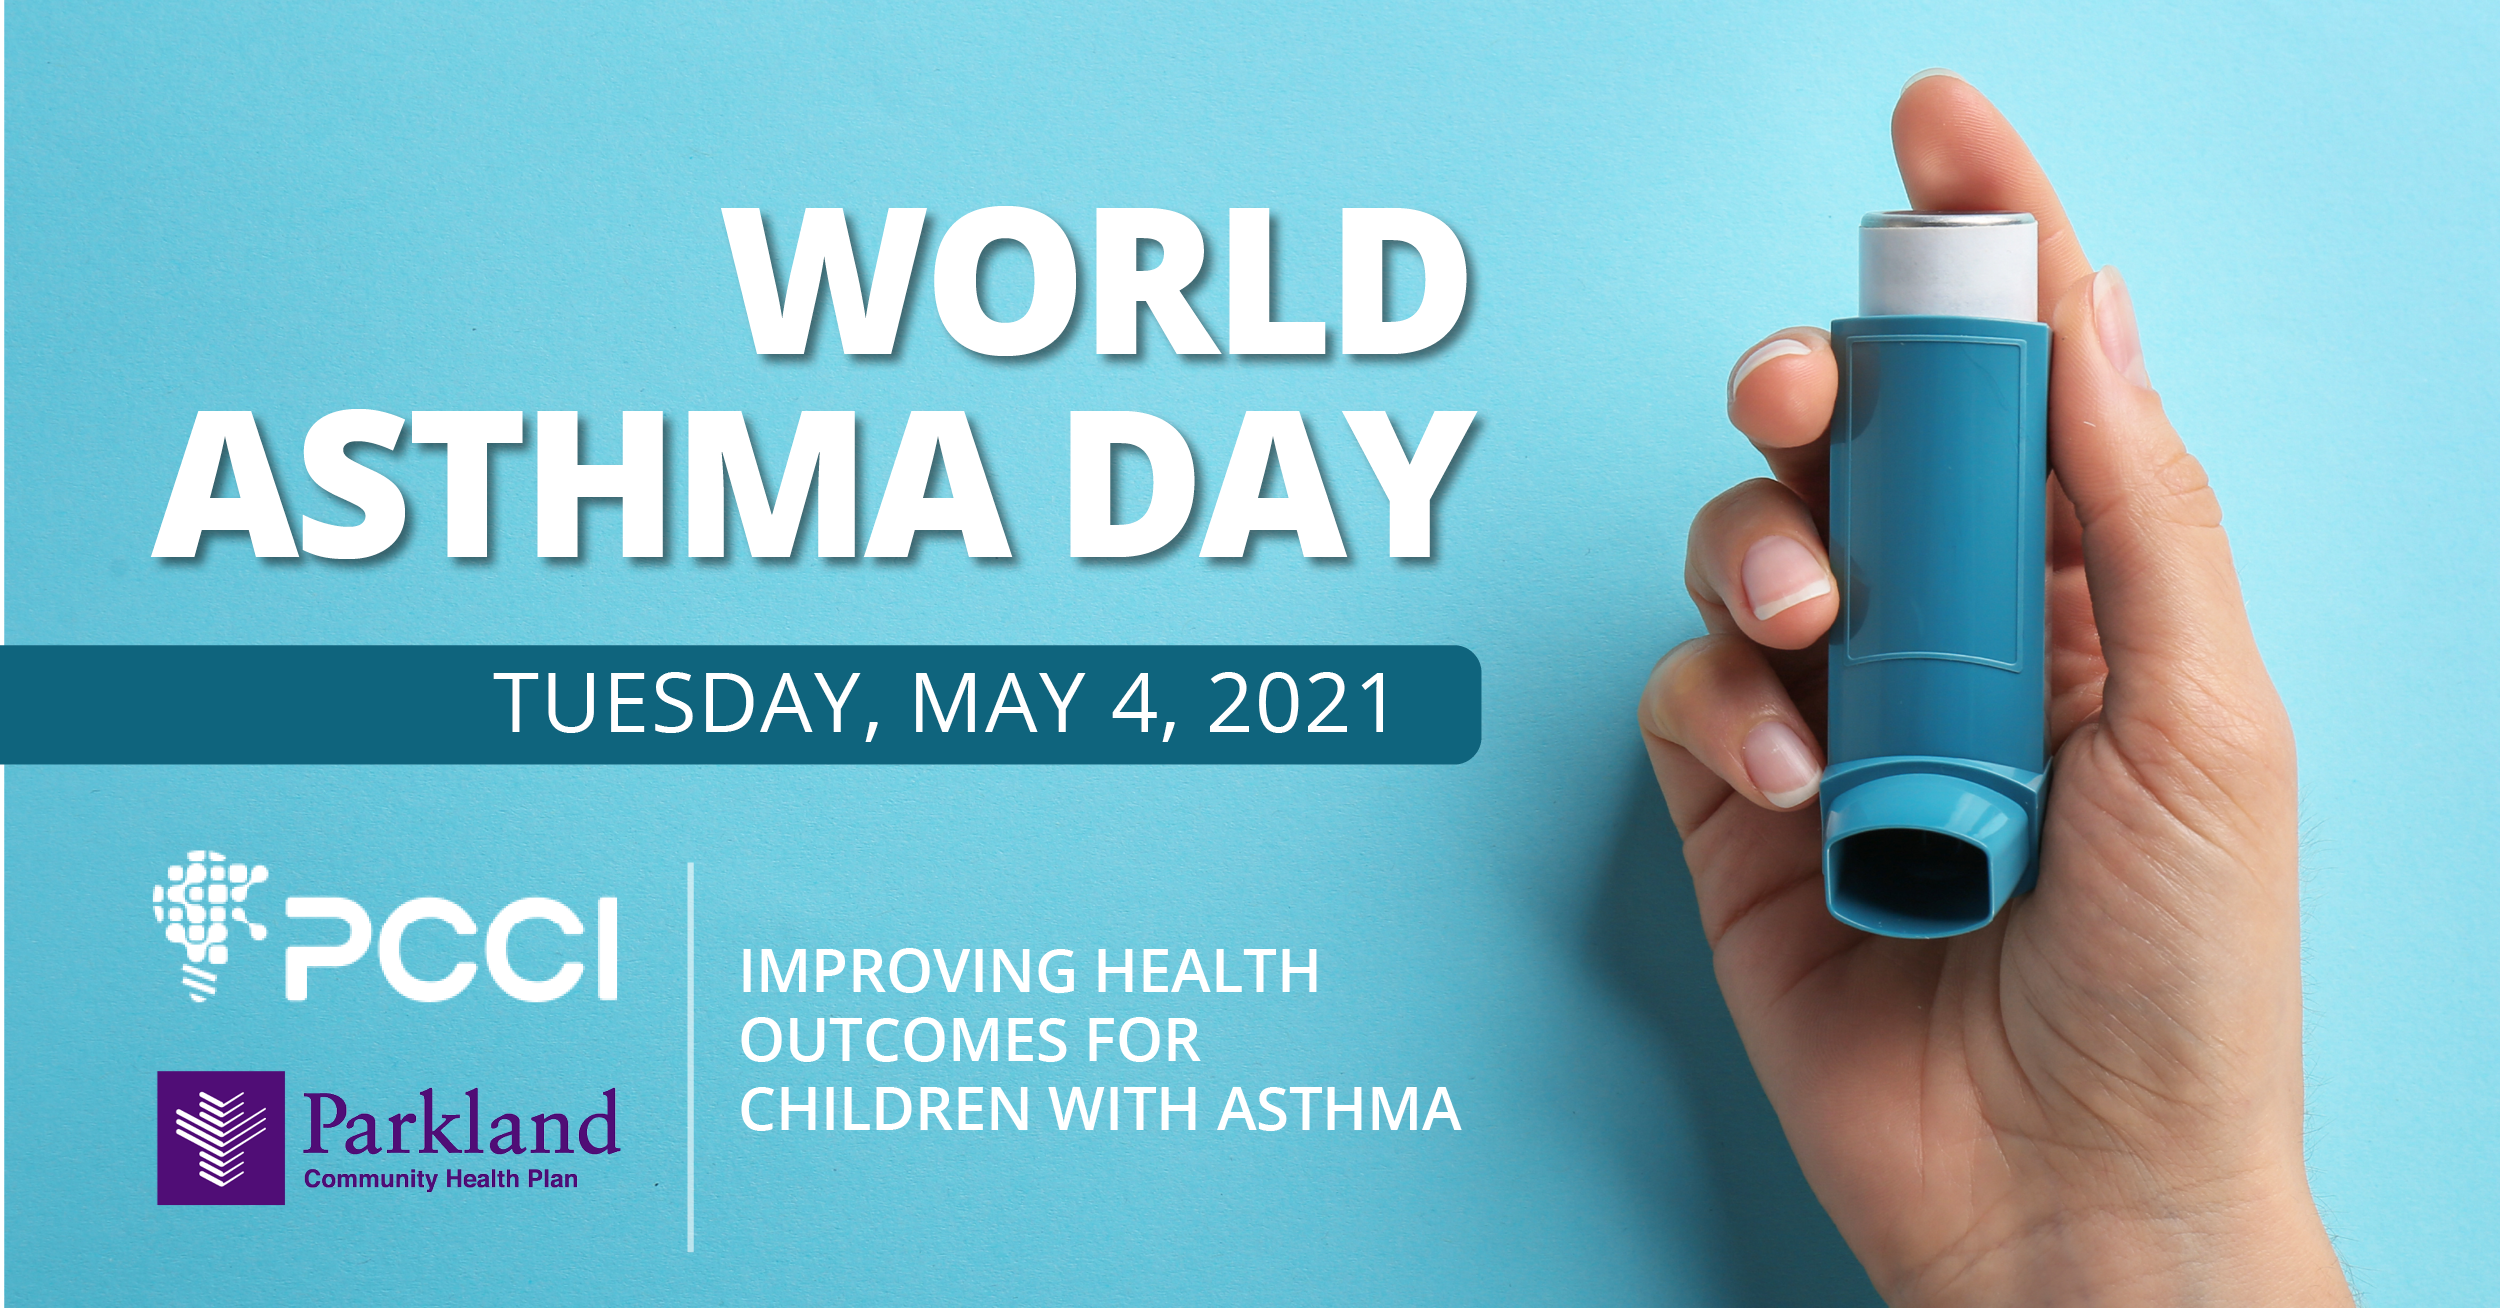
World Asthma Day: How PCCI’s predictive model helped improve care low-income children with asthma in Dallas

As part of May’s Asthma Awareness Month and World Asthma Day (May 4), PCCI is presenting its work, partnering with Parkland and the Parkland Community Health Plan, where its platform supporting pediatric asthma has helped thousands of children, dramatically reduced hospital visits and resulted in millions of dollars in cost savings. Following is an overview of the pediatric asthma programs that PCCI has played a key role in developing.

##

How PCCI’s predictive model helped improve care low-income children with asthma in Dallas

By Yolande Pengetnze, MD, MS, FAAP,
Senior Medical Director, Parkland Center for Clinical Innovation

Bringing together advanced data science and clinical expertise to help at-risk populations is a primary mission at PCCI and the results derived from our program to help improve care and outcomes for children with asthma, demonstrate the effectiveness of this approach.

Working closely with leaders from Parkland Community Health Plan’s (PCHP) team, PCCI developed a predictive model to help reduce the incidence and cost of asthma-related emergency department (ED) visits and hospitalizations among Medicaid-insured low-income Dallas children.

PCHP and PCCI launched the Pediatric Asthma Quality Improvement Program in April 2015. The program was driven by the large number of PCHP members with asthma. Asthma is the most common chronic disease of childhood affecting over 6 million children in the US and resulting in over 140,000 hospitalizations every year.

Asthma disproportionately impacts low-income, urban, Medicaid-insured children compared with privately insured children. Asthma, however, also is an ambulatory-care sensitive condition, meaning that appropriate outpatient care and self-care can prevent unnecessary ED visits and hospitalizations, with subsequent substantial direct and indirect costs savings. The opportunity was ripe to really help disadvantaged children with asthma.

How the predictive model works
Beginning in 2014, PCCI developed a logistic regression model to predict asthma emergency department (ED) visits or hospitalizations within the following three months for children with asthma, using clinical, health services utilization and socio-demographic variables from Medicaid claims data. The risk prediction model classifies every patient as Very-High-, High-, Medium-, or Low-risk for asthma ED visits or hospitalizations and the prediction is updated every month, based on new data input.

Compared to published predictive models, PCCI’s model has a very good predictive accuracy (C-statistic 0.84), is derived from a relatively large and diverse population [3] and is well-evaluated [4]. The PCCI asthma model is continuously evaluated and updated every year, to improve its accuracy and enhance actionable insights that guide clinical and community-based interventions. Deep learning methods have been and additional social determinants of health (SDoH) data have been evaluated to enhance model accuracy. Communitywide data sources have been incorporated to improve and fully assess model impact. Using this model, we were able to predict high risk asthma patients. We have integrated the risk-score into the electronic health record (EPIC) at Parkland as a Best Practice Alert (BPA), to drive timely and streamlined point-of-care interventions. We also generate monthly reports sent to frontline providers and Case Management teams and other non-traditional stakeholders. The monthly reports contained just the right amount of information on patients’ risk profile to drive seamless clinical and cross-organizational workflow integrations and tailored population-level interventions.

The interventions are adaptable: the reports are used, at the providers’ discretion, to either augment or streamline existing interventions or initiate targeted interventions, depending on clinical/community settings, resources, and priorities. The ultimate goals are to reduce unnecessary hospital utilization and cost, increase patient adherence to medication and preventive office visits, and improve overall health care experience. Moreover, we use the risk prediction model to directly engage higher risk patients into a text messaging program for patient education and medication reminders.

Finally, we used patient’s risk-stratification to identify providers caring for the highest risk patients and community sources of high-risk children for enhanced support for program participation and community-based interventions.

Dallas County Community Health Needs Assessment (CHNA) Quality Improvement (QI) Initiative
In 2019, Dallas County performed a Community Health Needs Assessment (CHNA) through which pediatric asthma was identified as a driver of high morbidity among children in the county. In 2020, a communitywide quality improvement (QI) program was launched aiming to improve asthma outcomes for all Dallas County children through data-driven interventions and cross-systems care coordination, following the PCCI Asthma Program model. To support this community-wide initiative, we enhanced our asthma risk prediction model with the addition of electronic health records data, which, together with claims and social determinants of health (SDoH) data, predict asthma risk among Dallas County children with asthma.

The new model retains a good prediction ability and provides additional clinical insights not previously available using claims data only. With the addition of electronic health records data, our new asthma model can be used for all children irrespective of insurance status, thus expanding the benefits of our program to more vulnerable children with asthma. The asthma text messaging program also has been expanded to impact all children with asthma, irrespective of insurance status.

Moreover, community-based services providers in the social and Public Health sectors have been engaged to use PCCI asthma risk reports for community-based interventions beyond the traditional health care system. Community-based organizations and the Dallas County Health and Human Services department now use PCCI risk reports to drive community-based interventions such as home visits and outreach in community gatherings. The Dallas independent school district is also being engaged to use the risk reports for school-based interventions.

PCCI’s asthma risk model and reports are driving cross-organizational workflows and communitywide care coordination across North Texas, to improve health, educational, and quality of life outcomes for children with asthma and their families.

Insightful Community Risk Mapping
Over the past two years, we have added data insights capability to the program using local and regional maps to identify geographical areas with high risk patients and support targeted community outreach. Overlaying asthma risk maps with SDoH maps (down to the block group level, see above) has uncovered discrete neighborhoods with asthma-risk and high social needs that might contribute to poor asthma outcomes, including transportation and childcare needs. These opportunity maps are driving community engagement to improve health, education, and wellbeing of children with asthma and their families.
Results

Since inception, PCCI’s pediatric asthma population health framework has not only reduced unnecessary hospital visits and costs, it has improved the healthcare experience for thousands of pediatric patients and their parents. The updated five-year impact report includes:

• Program expanded to support the communitywide Dallas County CHNA Asthma Quality Improvement initiative
• ~93,000 unique children with asthma risk-stratified to-date across both initiatives (PCHP and CHNA Asthma QI)
• Over 22,000 children with asthma risk-stratified every month and ~45,000 every year, with a rapidly increasing impact
• Over ~1800 high-risk children with asthma impacted by the text messaging program
• 21 large and medium community healthcare provider practices actively engaged, including two large Federally Qualified Health Centers (FQHC) and Parkland’s large network of community-oriented primary care clinics (COPC)
• Non-traditional community services providers engaged, including community-based organizations, Dallas County Health and Human Services community health workers, and Dallas ISD, using risk reports for community-, home-, and school-based interventions
• Dallas Fort Worth Hospital Council Foundation engaged as a source of comprehensive communitywide data to support data-driven interventions
• 30 – 40 percent reduction in asthma-related ED visits
• 50 percent reduction in asthma-related inpatient admissions

• 50 percent drop in annual total asthma cost to PCHP
• Approx. $30 million saved as a result of the risk-driven, multi-stakeholder pediatric asthma framework
• Moreover, the text messaging program has yielded an additional 6-fold drop in asthma-related ED visits among participants vs. non-participants
• Over 85% of participants remain in the text messaging program for more than 12 months and >90% feel empowered to care for asthma as a result of the program

Ongoing Program Enhancements
As we continue this program, we are evaluating the role of emerging deep learning models to improve our risk prediction model performance and explanation. Our original logistic regression model served as the baseline benchmark against which deep learning model results would be compared. We, also, are looking into adding block-level social determinants of health to provide additional actionable insights into patients’ asthma risk profile.

Claims data have strengths and insufficiencies worth highlighting. Claims data consist of billing codes that health care providers and facilities submit to payers. claims data follow a consistent format and use a standard set of pre-established codes that describe specific diagnosis, procedures, medications, as well as billed and paid amounts [5]. Additionally, claims data document nearly all interactions a patient has across all the health care systems. They capture broader information for patients and provide access to larger and more diverse patient cohort. Claims data, however, have a time lag of about 30 to 90 days due to the processing time before they are finally added to the database and become available for analysis. We have begun the process of bringing in additional and timely data sources to enhance or supplement claims data, including electronic health records data and communitywide health and social data, which are progressively improving the timeliness, accuracy, and insights of our asthma risk prediction models and risk reports.

Conclusion
In conclusion, patient education, preventive care, and appropriate use of asthma controller medications are the cornerstone of effective asthma care. Accurate risk prediction of asthma ED visits or hospitalizations, timely provider reports, patient education, and communitywide stakeholder engagement drive the prioritization of evidence-based interventions tailored to the highest risk patients, to efficiently reduce asthma-related ED visits/hospitalizations and associated costs, and improve care experience among children with asthma. By bringing together all the factors from PCCI’s predictive model and applying them to thoughtful and direct interventions, at-risk group of children and their families can experience better outcomes that are beneficial from the health, cost, societal, and consumer experience perspectives. Through our comprehensive approach to whole-person care, , the benefits of PCCI’s risk -driven asthma quality improvement initiatives, which started with one health plan, are now reaching deeper into the North Texas community, bringing quality, coordinated care to vulnerable children where they live, learn, and play.

About the author
Yolande Pengetnze, MD, MS, FAAP, Senior Medical Director, joined PCCI in December 2013 as a Physician Scientist while remaining a Clinical Faculty at the University of Texas South Western (UTSW) School of Medicine and a practicing pediatrician at Children’s Health in Dallas, Texas. Her interests include the use of advanced predictive analytics integrating traditional and novel data sources to improve health outcomes at the individual and population level. She currently leads multiple projects at PCCI, including two population health quality improvement projects in pediatric asthma and preterm birth risk prevention. She received her MD in 1998 from the University of Yaounde in Cameroon, completed a Pediatric Residency training in 2008 at Maimonides Medical Center in New York City, and a Master of Science in Clinical Science at UTSW.

[1] M. Xu, K. G. Tantisira, A. Wu, A. A. Litonjua, J.-h. Chu, B. E. Himes, A. Damask, and S. T. Weiss. Genome wide association study to predict severe asthma exacerbations in children using random forests classifiers. BMC medical genetics, 12(1):90, 2011.

[2] E. Forno, A. Fuhlbrigge, M. E. Soto-Quirós, L. Avila, B. A. Raby, J. Brehm, J. M. Sylvia, S. T. Weiss, and J. C. Celedón. Risk factors and predictive clinical scores for asthma exacerbations in childhood. Chest, 138(5):1156– 1165, 2010.

[3] M. Schatz, E. F. Cook, A. Joshua, and D. Petitti. Risk factors for asthma hospitalizations in a managed care organization: development of a clinical prediction rule. The American journal of managed care, 9(8):538–547, 2003.

[4] A. L. Andrews, A. N. Simpson, W. T. Basco Jr, R. J. Teufel, et al. Asthma medication ratio predicts emergency department visits and hospitalizations in children with asthma. Medicare & Medicaid research review, 3(4), 2013.

[5] W. J and B. A. The benefit of using both claims data and electronic medical record data in health care analysis. Technical report, Optum Insight, 2012.

Slowing vaccination rates push back PCCI’s herd immunity forecast for Dallas County

Update on Dallas County Reaching COVID Herd Immunity From PCCI CEO Steve Miff

In February, Parkland Center for Clinical Innovation (PCCI) forecast that Dallas County had an opportunity to reach COVID herd immunity by mid-June. However, due to slowing vaccination rate, we have updated our forecast of Dallas County reaching the COVID herd immunity threshold to late-June with the possibility of falling back even further into July.

PCCI’s herd immunity forecasts in February was based on 80 percent of the county’s residents either having recovered from COVID-19 or having received vaccinations.

Today, herd immunity for the county is at 64 percent. While is represents progress, vaccination rates have slowed which is having a negative effect on our herd immunity forecast. The key driver making vaccine rates to regress include vaccine hesitancy and uptake, particularly in the working population.

While we’ve made great progress and to date vaccinated over 35% of the Dallas County population, including more than 73 percent of residents over 65 years old, the vaccination rates have been dropping, despite ample supply of vaccines and no wait times. In recent weeks, we’ve been averaging 45,000 vaccines administer per week, down from the mid and upper 60,000s in March. Therefore, due to the reductions in vaccinations, the herd immunity projections have been pushed to late June and could slip even further into July.

The longer it takes us to contain and crush COVID, the more chances the virus has to create new mutations that could be more transmissible, more deadly and more elusive to previously developed antibodies.

We encourage everyone to receive their COVID vaccination sooner than later. The quicker we can reach herd immunity the sooner we can return to safely interacting with our friends and families, teachers return to classes without fear and reduce the strain on our first responders, hospitals and their staff. But most importantly, reaching herd immunity via vaccines will help spare families the hardships of loved ones becoming ill or even losing their lives.

Steve Miff, PhD.
President & CEO
Parkland Center for Clinical Innovation

Doing Our Part to Help Prevent Premature Births

In observation of Black Maternal Health Week, Parkland Community Health Plan (PCHP), in partnership with Parkland Center for Clinical Innovation (PCCI) want to highlight our efforts in Dallas to prevent preterm births, which is especially impactful on women in under-served communities.

To better serve pregnant women in our community, PCCI and PCHP developed and implemented an innovative maternal health program that uses a machine learning algorithm, healthcare data and social determinants of health to identify pregnant women who are at a higher risk of pre-term birth. The program engages these women through text messages designed to help them be proactive in seeking care during pregnancy.

Proactive care is critical because American women are more likely to die from pregnancy-related causes than women in other high-income nations and their own mothers a generation before. National severe maternal morbidity (SMM) rates have nearly doubled over the past decade, and the occurrence of SMM was 166% higher for African American women than white women from 2012 to 2015. More broadly, African American and Latino women, as well as socioeconomically disadvantaged populations, are disproportionately affected by poor health outcomes due to pregnancy related causes.

“One of the major risk factors for pregnant mothers and newborn babies is pre-term birth,” said John Wendling, chief executive officer of Parkland Community Health Plan. “Apart from adding to the risk during delivery itself, there are so many other long-term health and well-being risks for the mother and the child when a baby is born prematurely.”

The rate of preterm birth in Texas is highest for Black infants (14%) followed by American Indian/Alaska Natives (11%), and Hispanics (10.6%). In 2019, in Texas, 1 in 9 babies was born preterm. While there are many efforts to address poor maternal health outcomes in the US, most focus on preventing deaths during labor and delivery. Not enough attention is paid to the larger environmental context and non-traditional risk factors such as educational achievement, body mass index, socioeconomic status and mental and behavioral factors.

“As a local community health plan, we need to protect our at-risk pregnant women and the program we partnered with PCCI on is a very effective way to help,” said Wendling. “This program is a great example of a health plan utilizing sophisticated AI, social determinants of health and digital technology to improve patient engagement and experience. The long-term result is that we’ve positively affected the overall health and wellness of families in our community.”

The program has been running successfully for over three years in seven counties in North Texas and has risk stratified 40,000 unique pregnancies. We’ve seen preterm births reduced by 20% during this period. In a survey of the program participants, 73% of respondents agreed this program made them better prepared to take care of themselves and their babies.

“Not enough funding in healthcare innovation goes towards serving the vulnerable populations and that has exacerbated the digital divide,” Steve Miff PhD, president and chief executive officer of PCCI. “This pre-natal program with PCHP is a powerful application of advanced data science and technology at the point of care that focuses on the whole person to improve lives for the most vulnerable.”

PCCI’s Vikas Chowdhry, MBA (chief analytics and information officer) and Dr. Yolande Pengetnze (senior medical director) have helped oversee the success of the program in collaboration with key stakeholders at PCHP including Dr. Mark Clanton (chief medical officer) and Paula Turicchi (chief strategy officer). PCCI has filed for several patents related to this platform.

“In addition to PCCI’s technology created to use data analytics for maternal and pediatric health, this cutting-edge platform has been key to impacting innovation for COVID-19 related work, Parkland Health and Hospital System and Dallas County,” Miff said. “This unparalleled use of machine learning algorithm, healthcare data and social determinants of health to create practical, usable solutions will continue to impact of this investment in Dallas county and beyond.”

About the author

Vikas Chowdhry, MS, MBA, is PCCI’s Chief Analytics and Information Officer with 15+ years of healthcare experience. He works closely with data science and clinical teams at PCCI to develop machine learning driven technologies and products that can empower clinical and social services providers and individuals to create communities that are healthier and more productive.

##

Governance: The Glue That Holds Connected Communities of Care Together

By Keith C. Kosel, PhD, MHSA, MBA

Aligning groups that have very different backgrounds and agendas, for the good of the community, is no easy matter. Whether at the city, state, or federal level, governmental or civic entities are tasked with trying to build consensus among various stakeholder groups to affect an outcome that works for the constituents they represent. It is no different for those tasked with leading a Connected Community of Care (CCC).

The Role of Governance
The premise behind the CCC is that by bringing together healthcare providers, community-based social service organizations (CBOs), faith-based organizations, and various civic entities, a community can establish a network of care providers focused on addressing residents’ social and/or clinical needs. While the premise is straightforward, establishing the governance group and governance structure to set up and manage a CCC is anything but straightforward. Before we look at how we might bring entities with different missions and agendas to the table, let’s understand what we mean by a governance group and a governance structure, and why these are essential to form a successful CCC.

The nucleus of a CCC is its governance group― those organizations that have come together to establish the CCC and to form the rules by which it will operate (the governance structure). As most CCCs form from scratch, the governance group is typically made up of one or two organizations we refer to as Anchor Organizations. These are typically large, well-established, and highly respected organizations within the community. They could include national social service organizations such as the United Way or Salvation Army, or they could be philanthropic funders, faith-based organizations or healthcare systems. What all these organizations have in common is a mission to improve the health and well-being of their community’s residents. As such they lie at the heart of the governance group (Figure 1).

Figure 1. Connected Communities of Care Including Governance Structure

In addition to the Anchor Organizations, the governance group typically consists of four to six additional Partner Organizations. These may be somewhat smaller CBOs (in scale and scope), but they all play a foundational community role in addressing resident’s social and/or clinical needs. Partner Organizations are well-known within the community and historically work closely with the Anchor Organizations. Partners could be regional food banks, housing assistance providers, crisis centers, mental health providers, local school districts, etc.― all defined by the fact they deliver essential social or clinical services within the community.

The role of the governance group is to provide structure and guidance for the CCC. By structure we mean things like: (1) how network participants will be identified and approved, and what will be expected of each; (2) what the CCC’s mission and charter will include; (3) how the CCC will be funded; and what type of data must be collected and shared, consistent with HIPAA regulations. While the governance structure deals with establishing the rules and policies that guide the day-to-day workings of the CCC, the governance guidance function focuses on issues like: (1) support for a Readiness Assessment (See previous blog) to determine if the community needs― and is even ready for ―a CCC; (2) how and at what rate the CCC should grow; (3) strategic partnerships; and (4) CCC sustainability. A governance group is essential to establishing and growing the CCC. Moreover, without a strong, representative and resilient governance group, most CCCs will eventually fail.

Act 1 -Forming the Governance Group

While we might think that forming the Governance Group would be a fairly easy task, given that many Anchors and Partners already know one other, in reality the process is far more complicated. While many of the Anchor and Partner Organizations work in parallel, they often have a narrow topical focus, such as providing food, housing, healthcare or after-school programs. These topical focus areas may conflict either with regard to the purpose of the work or the process by which the work takes place. As an outsider looking in, we might think these are minor, easily solved issues when in fact they are anything but. Layer on top of this funding mechanisms that often are not uniform or are based on an organization’s own performance to support its mission within the broader CCC, and simple differences compound quickly. As the number of Anchor and Partner Organizations increases, the complexity of achieving alignment among these entities also increases dramatically. This is the point where the presence of a powerful and commanding Anchor Organization(s) become critical in driving alignment.

Because there are usually only one or two Anchor Organizations, the likelihood of disagreement is minimized, compared to the next governance level down (i.e., Partners). Typically, the Anchor Organizations individually have been contemplating a Connected Community of Care for some time and all it takes is the right “spark” at the right moment to bring them together. Further, Anchor Organizations by their nature are well versed in coalition building and working across multiple sectors, which is a skill set that may be less well-developed in the Partners, especially in smaller or rural communities.

A key function of an Anchor Organization is to bring a handful of Partner Organizations into the governance group. Here the Anchor’s skill in selecting collegial partners or ones that can easily be won over to align with the CCC’s mission and goals is extremely important. Including a Partner that will be disruptive or non-cooperative is a fatal error, regardless of what resources that Partner might control. Even if it means working harder to secure the necessary resources, it is better to include only cooperative and committed partners than to access resources at the cost of major disruption.

Act 2 – Moving the Governance Group Forward
Establishing a highly cohesive and well-functioning governance group is only the first step in an ongoing process to grow a successful CCC. The governance group must continue to evolve along with the CCC network. As the network expands, there may be a need to increase representation within the governance group. While warranted, this process must be handled carefully to avoid the disruption just mentioned. At the same time, the governance group may need to remove some participants from the network for failing to follow the CCC’s charter or for sub-standard performance. Although these are difficult decisions, neglecting to make them can irreparably damage the entire CCC over time.

In wrestling with these decisions, the governance group must always be focused on sustainability – sustainability of the CCC and of the governance group itself. Sustainability of the CCC takes different forms from operational sustainability to financial sustainability, each of which are indispensable to a CCC’s long-term growth and viability. Operational sustainability focuses on the challenges of keeping the CCC network up-to-date with regard to technology, strategic partnerships, growth through additional participants, and ongoing social and health needs assessments (i.e., is the prevalence of obesity increasing silently in the community? Are more people accessing utility assistance in the face of declining employment as businesses relocate to more favorable locations?). It also includes provisions for turnover at both the CCC administrative level and at the level of the CBOs, which historically have high turnover levels due to numbers of volunteer staff, etc.

Achieving financial sustainability is the ultimate challenge facing CCC governance groups. Without sustained funding, whether through internal or external means, a CCC cannot survive long term as an effective functioning network. The real challenge is not only securing funding but doing so in a way that benefits all network participants in some fashion based on need and contribution. When network participants must seek funding on their own, inequities are prone to develop, as participants begin to follow their own interests rather than the collective interest of the CCC. Though a difficult challenge, especially in today’s pandemic environment of scarce funding, CCC governance groups must confront it head-on.

CCC governance is not an easy or straight road. Rather it is strewn with potholes, stop signs and detours- but one that must be followed none the less if a CCC is to achieve its goal of improving the health and well-being of the community and its residents. The time and thought that goes into establishing a cohesive and highly effective governance group and structure will pay dividends to the CCC and those it serves many times over as the CCC grows and matures to become a key fixture within the community.

About the author
Dr. Keith Kosel is a Vice President at Parkland Center for Clinical Innovation (PCCI) and is author of “Building Connected Communities of Care: The Playbook for Streamlining Effective Coordination Between Medical and Community-Based Organizations,” a guide that brings together communities to support our most vulnerable. At PCCI, Keith is leveraging his passion for – and extensive experience in – patient safety, quality, and population health by focusing on understanding social determinants of health and the impact of community-based interventions in improving the health of vulnerable and under-served populations.

PCCI’s Vulnerability Index Records 66 Percent Reduction in COVID-19 Risk for Dallas County

DALLAS – Dallas County saw a massive 66 percent reduction in risk values recorded by PCCI’s COVID-19 Vulnerability Index in February, with some of the most vulnerable ZIP codes showing significant reductions.

One of the hardest hit ZIP Codes, 75211, which includes the areas around Cockrell Hill and Oak Hill, saw its vulnerability risk value drop by 151.9 points, going from 196.9 vulnerability rating in January to 44.9 in February. The 75211 ZIP code remains the second most at risk area in Dallas County, however its overall improvement is a positive sign for the hard-hit area.

“The dramatic drop in the county’s vulnerability is positive and offers a hopeful path going forward,” Thomas Roderick, PhD, Senior Director of Data and Applied Sciences at PCCI. “We are remaining cautious as we saw vulnerability rates come down

last summer only to see increase significantly later. The key to continued reduction of vulnerability is ongoing vigilance, including continued adhering to local health official guidance, social distancing, face covering, and registering for vaccinations as soon as you’re able.”

Launched in June of 2020, PCCI’s Vulnerability Index identifies communities at risk by examining comorbidity rates, including chronic illnesses such as hypertension, cancer, diabetes and heart disease; areas with a high density of populations over the age of 65; and increased social deprivation such as lack of access to food, medicine, employment and transportation. These factors are combined with dynamic mobility rates and confirmed COVID-19 cases where a vulnerability index value is scaled relative to July 2020’s COVID-19 peak value. The PCCI COVID-19 Vulnerability Index

can be found on its COVID-19 Hub for Dallas County at: https://covid-analytics-pccinnovation.hub.arcgis.com/.

In addition to the drop in 75211, the ZIP code 75204, in east downtown Dallas, saw a 104.4 drop in its vulnerability ratings. ZIP code 75224, in southern Dallas, saw a drop of 64.9 in its vulnerability ratings, but now is ranked as the most vulnerable area in Dallas County with a vulnerability value of 45.87. Also, the ZIP code 75227, in east Dallas County intersected by State Highway 12, is the third most vulnerable area in Dallas with a 42.45 value, though it dropped 70.5 in its vulnerability ratings since January.

“Holidays and events are potential super-spreader events,” said Dr. Roderick. “We are in a time of year where these tend to

be limited, which impacts ongoing COVID-19 cases. However, Spring Break and occasional holidays on the calendar represent potential trouble times. PCCI will continue monitoring for things that can push Dallas County into higher levels of vulnerability.”

PCCI recently forecast that Dallas County may reach COVID-19 herd immunity by mid-June. This, Dr. Roderick points out, is only possible though vaccinations.

“We each need to be patient as well as register and receive our COVID-19 vaccination,” said Dr. Roderick. “The only way we will reach herd immunity is by maintaining our vigilance and getting vaccinated. Reaching herd immunity is a community effort and should be a priority for each of us.”

PCCI recently launched the MyPCI App, another program to help inform the residents of Dallas County to their individual risks. The MyPCI App, free to register and use, is a secure, cloud-based tool that doesn’t require personal health information and doesn’t track an individual’s mobile phone data. Instead, it is a sophisticated machine learning algorithm, geomapping and hot-spotting technology that uses daily updated data from the Dallas County Health and Human Services (DCHHS) on confirmed positive COVID-19 cases and the population density in a given neighborhood. Based on density and distances to those nearby who are infected, the MyPCI App generates a dynamic personal risk score.

To use the MyPCI App, go to, https://pcci1.wpengine.com/mypci/, click on the link and register (Using code: GP-7xI6QT). Registration includes a request for individual location information that will be used only for generating a risk assessment, never shared. Once registered, simply login daily and a COVID-19 personal risk level score will be provided along with information to help individuals make informed decisions about how to manage their risk.

Data Sources:
To build Vulnerability Index, PCCI relied on data from Parkland Health & Hospital System, Dallas County Health and Human Services Department, the Dallas-Fort Worth Hospital Council, U.S. Census, and SafeGraph.

About Parkland Center for Clinical Innovation
Parkland Center for Clinical Innovation (PCCI) is an independent, not-for-profit, healthcare intelligence organization affiliated with Parkland Health & Hospital System. PCCI leverages clinical expertise, data science and social determinants of health to address the needs of vulnerable populations. We believe that data, done right, has the power to galvanize communities, inform leaders, and empower people.

###

January COVID-19 Vulnerability Index Update: Risks Intensifying to Highest Levels of The Pandemic

DALLAS – The post-Christmas and New Year’s holidays contributed to soaring risk values recorded by PCCI’s COVID-19 Vulnerability Index, beyond any previously recorded levels. However, with the end of the holiday season, PCCI experts are optimistic that January’s extreme spike is the infection’s peak.

“With the major 2020 holidays concluded, over the next several months we can see the return to daily life on the horizon,” said Thomas Roderick, PhD, Senior Director of Data and Applied Sciences at PCCI. “With ongoing vigilance, including continued adhering to local health official guidance, social distancing, face covering, and registering for vaccinations as soon as you’re able, we can anticipate that the recent high case counts are behind us.”

Launched in June, PCCI’s Vulnerability Index determines communities at risk by examining comorbidity rates, including chronic illnesses such as hypertension, cancer, diabetes and heart disease; areas with a high density of populations over the age of 65; and increased social deprivation such as lack of access to food, medicine, employment and transportation. These factors are combined with dynamic mobility rates and confirmed COVID-19 cases where a vulnerability index value is scaled relative to July 2020’s COVID-19 peak value. The PCCI COVID-19 Vulnerability Index can be found on its COVID-19 Hub for Dallas County at: https://covid-analytics-pccinnovation.hub.arcgis.com/.

While there are signs that the recent peak may be over, January’s Vulnerability Index numbers showed that Dallas County was severely battered by COVID-19, especially in the ZIP codes struggling with socioeconomic issues. For example, the ZIP code 75211, around Cockrell Hill, continues to top the most at-risk area in Dallas, as it has since the Vulnerability Index began recording data in June. However, in January, 75211, the area exceeded the record value that it set in December, increasing its vulnerability value by 38.9 points. The ZIP code 75243 holds the position as the second most vulnerable area in Dallas County with a vulnerability value of 129.99.

“The ZIP codes, 75211 and 75243 are two areas of Dallas County facing the highest socioeconomic challenges; the fact that they are the most identified as highly vulnerable to COVID-19 shows how the PCCI Vulnerability Index is helping shine the

light on where the help is needed most,” said Dr. Roderick. “The entire healthcare community in Dallas County is striving to equitably mitigate the spread of COVID-19, and the Vulnerability Index offers factual data to support that effort.”

Other ZIP codes with major leaps in their vulnerability values include 75217, 75204 and 75040. The top-most vulnerable ZIP codes averaged a vulnerability value of 100.53 in January compared to the top-most in December that averaged a vulnerability value of 79.77, underscoring the rise in cases from mid-December 2020 to mid-January 2020.

PCCI recently launched the MyPCI App, another program to help inform the residents of Dallas County to their individual risks. The MyPCI App, free to register and use, is a secure, cloud-based tool that doesn’t require personal health information and doesn’t track an individual’s mobile phone data. Instead, it is a sophisticated machine learning algorithm, geomapping and hot-spotting technology that uses daily updated data from the Dallas County Health and Human Services (DCHHS) on confirmed positive COVID-19 cases and the population density in a given neighborhood. Based on density and distances to those nearby who are infected, the MyPCI App generates a dynamic personal risk score.

To use the MyPCI App, go to, https://pcci1.wpengine.com/mypci/, click on the link and register (Using code: GP-7xI6QT). Registration includes a request for individual location information that will be used only for generating a risk assessment, never shared. Once registered, simply login daily and a COVID-19 personal risk level score will be provided along with information to help individuals make informed decisions about how to manage their risk.

“We have seen that proximity is one of the most important factors in pandemic management and personal protection,” said Dr. Roderick. “While we wait for vaccine programs to take hold, we can use the MyPCI App to control our own risk of exposure and help bend the curve.”

 Data Sources:

To build Vulnerability Index, PCCI relied on data from Parkland Health & Hospital System, Dallas County Health and Human Services Department, the Dallas-Fort Worth Hospital Council, U.S. Census, and SafeGraph.

About Parkland Center for Clinical Innovation

Parkland Center for Clinical Innovation (PCCI) is an independent, not-for-profit, healthcare intelligence organization affiliated with Parkland Health & Hospital System. PCCI leverages clinical expertise, data science and social determinants of health to address the needs of vulnerable populations. We believe that data, done right, has the power to galvanize communities, inform leaders, and empower people.

###


Get Your COVID19 Person Risk Score Now

To register and login to the MyPCI App to quickly understand your personal risk of COVID-19 exposure in Dallas County, please click on the image below below or go to: https://mypci.pccinnovation.org/my-proximity to register, Using code: GP-7xI6QT. The first assessment takes 24 hours.


PCCI IMPACT: Serving The Whole Community

PCCI strives to achieve the broadest community-wide impact through: (1) support of initiatives closing the gap between
providing clinical care and addressing non-medical needs to positively impact whole-person health; (2) support of
Parkland and its CHNA strategic priorities; and (3) support of PCHP as it strives to quantify community impact.

Below is a sample of PCCI’s work that is having an important impact on our community. For a much more detailed report, contact us for a copy of PCCI’s Annual Impact Report, where PCCI’s actions are shared in much greater detail.

To get the full Annual Impact Report, please click HERE, select “other” and in the message box, add “Annual Impact Report” to receive your electronic copy.

PCCI Impact: Optimizing How Care Is Delivered in 2020

In addition to PCCI’s critical collaboration with Parkland to address the care capacity and front line care-management
challenges resulting from the COVID-19 pandemic, we have continued efforts this year to develop tools that enable care delivery teams to intervene earlier, respond differently, or prioritize engagement strategies. For example, our The Parkland Trauma Index of Mortality and PARADE (Patients at Risk for Adverse Drug Events) projects provide innovative and practical tools for improving clinical outcomes.

Below is a sample of PCCI’s work that is having an important impact on how providers deliver care. For a much more detailed report, contact us for a copy of PCCI’s Annual Impact Report, where PCCI’s actions are shared in much greater detail.

To get the full Annual Impact Report, please click HERE, select “other” and in the message box, add “Annual Impact Report” to receive your electronic copy.