Disparities Next Door: PCCI’s Community Vulnerability Compass spotlights areas of increased vulnerability across Dallas County
Dallas, Texas(Sept. 19, 2024) – Researchers at Parkland Center for Clinical Innovation (PCCI) have highlighted areas of increased vulnerability within Dallas County after conducting an analysis using PCCI’s Community Vulnerability Compass (CVC). The findings include a number of pockets of highly vulnerable areas within many low vulnerability ZIP Codes.
PCCI’s CVC analyzes, at the ZIP Code, census tract, and block-group level, where a community’s most vulnerable residents live and the root cause factors limiting these residents’ ability to thrive. The CVC analyzes 26 clinical and socio-economic indicators that reveal the health, resiliency, and economic vibrancy of neighborhoods. CVC’s analyses provide true, holistic pictures of who needs the most assistance and where to find them, enabling proactive support of those in need.
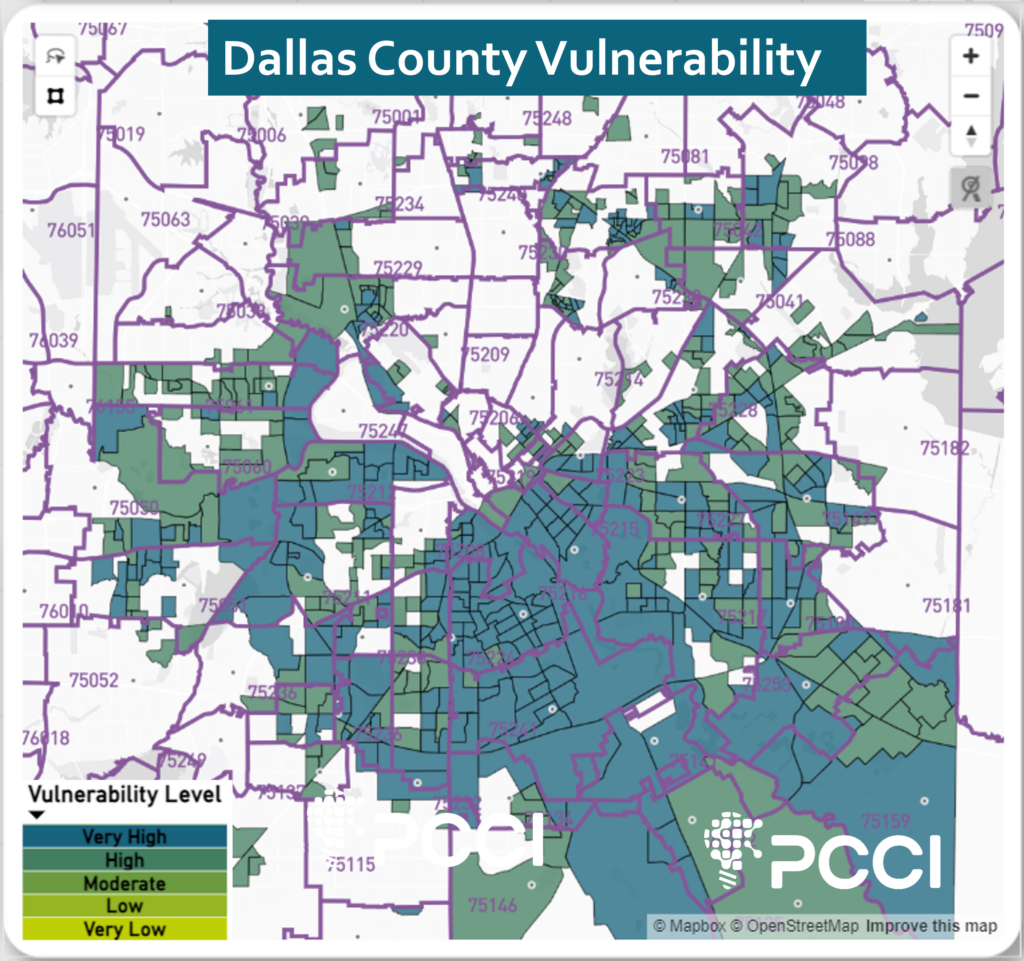
It is well-documented that many ZIP Codes in the south and southeast areas of Dallas County (see image 1) are home to long-standing socio-economically disadvantaged populations and have the highest vulnerability rating. However, PCCI’s analysis underscores what Parkland and other officials have long stated: that in addition to the south and southeast regions, there are other ZIP Codes in Dallas County with low vulnerability but are home to highly vulnerable block groups. Specifically, these include 18 Dallas County ZIP Codes with an overall very low or low vulnerability rating that contain within them 48 block groups with high or very high vulnerability ratings. The 18 ZIP Codes have a total population of 590,971, with 72,954 (12.3%) of their residents living in these very high vulnerability blocks groups.
“In some cases, we find that a very high area of vulnerability is across the street from a very low area of vulnerability.“
Steve Miff, phd, President and CEO of PCCI
The “very high” designation indicates that these neighborhoods are in the top 20% of vulnerability when compared to the rest of Dallas County. CVC vulnerability groupings are localized to the Dallas County geography and broken into quintiles and clustered into very low, low, moderate, high and very high areas.
“For good reason we focus a lot of our efforts on supporting the underserved communities in south and southeast Dallas County, but CVC empowers us with refined geographic precision to examine our broader community and uncover data that provides a high-resolution understanding of social vulnerability factors within other micro-geographies in our community,” said Steve Miff, PhD, President and CEO of PCCI. “In this examination, CVC highlights areas of deprivation that may be masked by gentrification and/or historical surrounding prosperity. In some cases, we find that a very high area of vulnerability is across the street from a very low area of vulnerability.”
For example, ZIP Code 75206, located in the Greenland Hills area that runs along Highway 75 and is bordered by Highway 12 and Skillman Avenue, is rated very low vulnerability by the CVC, but includes four block groups that are rated by the CVC as high and very high vulnerability. In this ZIP Code, which has a total population of 38,209, there are 2,661 (7%) who experience high or the very highest levels of vulnerability as measured by the CVC.
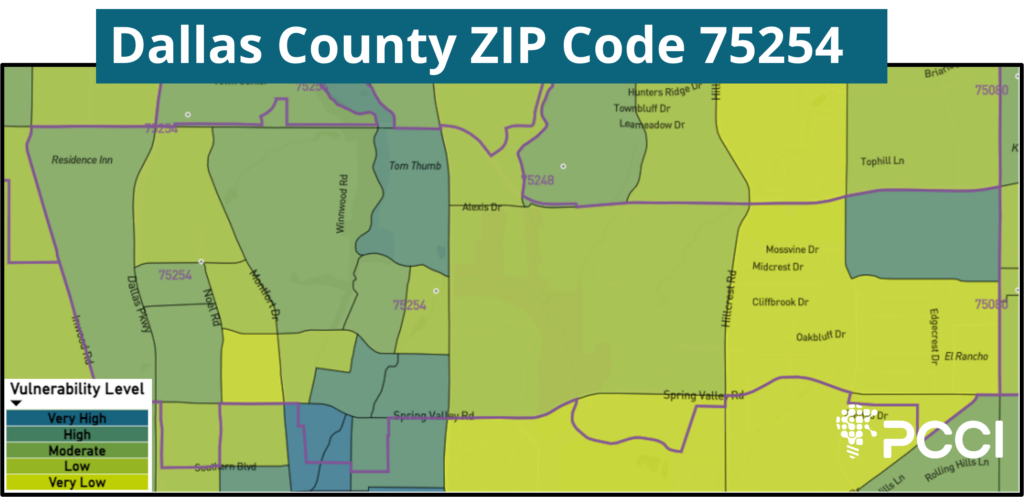
One ZIP Code of note, 75254, located north of the Galleria between Dallas North Tollway and Coit Road, has an overall low vulnerability rating, but includes 8 high or very high vulnerability blocks. Of this area’s total population of 24,047, 12,522 (52.1%) residents experience high or very high vulnerability. (see Image 2)
Additionally, ZIP Code 75230, which is considered to be an economically advantaged area in North Dallas between Walnut Hill and Interstate 635, includes a very high vulnerability block group.
“The lesson is that we need to look beyond our expectations and understand that disparities and vulnerability are all around us no matter how prosperous a given area may appear,” Miff said. “We hope this will bring an additional level of high-resolution, hyper-localized understanding of social vulnerability factors and empower leaders across all communities with relevant information to improve and sustain the lives of all Dallas County residents. North Texas has outstanding public health leaders who are doing a great job supporting vulnerable populations throughout the county and we hope this helps them as well as policymakers, community-based organizations and others who are vested in helping mitigate disparity.”
IMAGE 1
IMAGE 2
About PCCI
The Parkland Center for Clinical Innovation (PCCI) is a not-for-profit, mission-driven organization with industry-leading expertise in the responsible application of artificial intelligence, machine learning and NMDOH data modeling to address the needs of vulnerable populations. PCCI started as a department within Parkland Health and was spun out as an independent organization in 2012. PCCI strives to leapfrog the status quo by harnessing the transformative potential of data. Our unique capabilities allow us to provide innovative, actionable solutions that more effectively identify needs, prioritize services, empower providers, and engage patients.
Pegasus Park Non-profit Innovators Collaborating with PCCI’s Community Vulnerability Compass, Offering Custom Data Insights to Accelerate Each Organization’s Efforts
Sponsored by the Water Cooler at Pegasus Park, The Dallas Foundation, and Lyda Hill Philanthropies, seven tenants at the Pegasus Park innovation hub are participating in a community of practice utilizing PCCI’s Community Vulnerability Compass (CVC) to help further their community-driven missions.
PCCI’s CVC is a technology toolkit that provides customized, foundational insights on community needs and complements insights generated by individual organizations. Through an easy‐to‐use web‐based dashboard, the CVC offers summarized information and root-cause details of neighborhood vulnerabilities that drive inequity. PCCI’s CVC is leveraged by organizations around the state, such as the United Way of Metropolitan Dallas, to improve their understanding of the community they serve. Through a fuller understanding of these root causes, these innovative organizations can better align efforts to create connected communities and develop better programs, resources, and interventions to eliminate disparities, achieve health equity, and improve the lives, health and well‐being of underserved residents and communities.
The participating Water Cooler-based organizations include innovative non-profits with missions to build a better community for all. They are:
The City Year AmeriCorps members serve in schools all day, every day, preparing students with the social, emotional, and academic skills and mindsets to succeed in school and in life.
The Grant Halliburton Foundation works to strengthen the network of mental health resources for children, teens, and young adults; promote better mental health; and prevent suicide.
The Junior Achievement of Dallas (JA Dallas), a nonprofit organization impacts the lives of students by teaching life skills in budgeting, careers, and business start-ups. JA Dallas’s mission is to inspire and prepare young people to succeed in a global economy through volunteer-delivered curriculum.
Social Venture Partners Dallas is committed to helping individuals realize greater impact with their giving, strengthening nonprofits, and investing in collaborative solutions.
Texas Trees serves as a catalyst in creating a new green legacy for North Texas through transformational, research-based plans that educate and mobilize the public to activate the social, economic, environmental, and health benefits that trees and urban forestry provide for a better quality of life.
The Commit Partnership is a collective impact organization composed of hundreds of partners across Dallas County and the state of Texas supported by a dedicated ‘backbone’ staff of 60+ professionals.
Established as the first community foundation in Texas in 1929, the Dallas Foundation brings together people, ideas, and investments in Greater Dallas so individuals and families can reach their full potential. Over the course of the Foundation’s history, it has granted over $1B to the full spectrum of community-centered causes.
“We are honored to partner with and support our colleagues at the Water Cooler at Pegasus Park with the capabilities that the CVC offers,” said Steve Miff, CEO of PCCI. “The program’s sponsors, Water Cooler at Pegasus Park, The Dallas Foundation, and Lyda Hill Philanthropies, are strong supporters of the missions of each of the participating organizations and we are exceedingly grateful to them for helping support these collaborations to build a better community.”
Water Cooler’s mission is to support organizations in their quest to attract and retain talent, engender collaboration among members, reduce administrative costs, and ultimately, increase collective impact on key social issues. Water Cooler’s nonprofit and philanthropic tenants are co-located among five floors and roughly 175,000 square feet within Pegasus Park’s main 18-story tower in Dallas. The Water Cooler at Pegasus Park is sponsored by Lyda Hill Philanthropies, in partnership with J. Small Investments and Montgomery Street Partners and managing partner The Dallas Foundation.
PCCI, founded in 2012, is a not-for-profit, healthcare innovation and research organization affiliated with Parkland Health. PCCI leverages clinical expertise, data science, and Non Medical Drivers of Health to address the needs of vulnerable populations.
An interactive tool to navigate NMDOH-based needs of vulnerable populations
The CVC is a web-based tool enabling its users to visualize and more fully understand the context and complexities of the social barriers to health, access, and well-being of a community’s most vulnerable populations.
Based on the Healthy People 2030 framework seeking to achieve health equity, eliminate disparities, and promote good health for all, the CVC includes 26 clinical and socio-economic indicators clustered into four thematic domains denoting the health, resiliency, and economic vibrancy of neighborhoods.
Through a user-friendly dashboard, individuals can view which indexes, subindexes, and indicators are impacting vulnerability. They can utilize the dashboard’s dynamic online mapping feature, tabulated scores of indicators, and detailed analytics around other attributes that may affect vulnerability scores (e.g., race/ethnicity and demographics).
Key Features of the CVC
• Information can be visualized at the county, ZIP code, census tract, and block-group levels, giving users both a “forest and trees” view of a community. Intended to serve as a more detailed complement to other research studies (e.g., Community Health Needs Assessments) and field-based community voice initiatives, the CVC provides a comparable, data-driven summary of insights about community vulnerabilities.
• Users can also drill down to ask a series of follow-up “why” questions to really understand the root causes of inequities–a capability that is absent from other available tools.
• Insights provided by the CVC enable users to more effectively and efficiently prioritize, plan, and deploy–in a hyper localized way–supportive resources and interventions targeted to individuals or populations to advance whole-person health.
Vulnerable populations are groups of individuals (e.g., racial and ethnic minorities, the economically disadvantaged, those with chronic health conditions) who are at greater risk of poor health and well-being due to significant health and healthcare disparities (i.e., physical, economic, and social inequities). Their health and healthcare needs are most heavily driven by socio-economic, or Non Medical Drivers of Health (NMDOH), factors such as lack of education, language barriers, and difficulty in accessing care (e.g., transportation barriers, absence of internet connectivity, deficiency in insurance coverage). However, assessing, understanding, and addressing these NMDOH issues is not a simple or straightforward process for any organization seeking to improve the health of these residents. Specific unmet needs include:
• The need to look across NMDOH factors to gain a holistic picture. For individuals facing high vulnerability, rarely is there only one issue they are facing; they often have multiple, complex needs. In addition, language and cultural barriers, issues with health literacy, and the organization’s own lack of resources all work against obtaining this understanding (e.g., through individual interviews) for the required number of individuals and frequency needed for impact.
• The need for a shared language across communities. In addition, evidence continues to mount that an upstream, cross-sector approach to health can result in more positive, sustainable health outcomes. A broad, community-based approach focusing on societal conditions, disruption of structural barriers (e.g., cross-sector silos), and targeted risk-driven interventions for collective impact can more effectively and sustainably remove health inequities and transform a person’s quality of life and health outcomes. However, organizations across communities use disparate data sources and different measure sets, meaning there is a lack of standardization needed to efficiently build needed cross-sector networks, create a common starting point, and effectively evaluate progress over time.
• The need to have the means to conduct root cause analyses. While there are a number of publicly available indexes that measure vulnerability, there are few that enable the root cause analyses needed to effect lasting change (i.e., showing the specific NMDOH factors that are most impacting vulnerability in any given block group at any given time).
CVC addresses all of these needs and is rapidly becoming the go-to resource for teams addressing the needs of vulnerable populations.
CVC Is Built for both Clinical and Community-Based Organizations
The CVC can help virtually any organization (hospital system/health plan, care provider, CBO, public health entity, philanthropic funder, etc.) seeking to understand not only where its Community’s most vulnerable residents live but also many of the underlying, multi-dimensional root cause factors driving these residents’ poor health and healthcare access and ability to thrive. Through a fuller understanding of these root causes, organizations can develop better programs, resources, and interventions to eliminate disparities, achieve health equity, and improve the health and well-being of vulnerable residents.
CVC is an extremely useful tool for health systems and health plans who have made a commitment to community-based programming and need data-driven insights to support contemplated strategic objectives (e.g., new clinic locations). CVC insights can provide critical, contextualized information to guide these organizations and help them prioritize strategic imperatives.
CVC is especially useful for providers who have made commitments around addressing NMDOH. Given the Health Systems/Health Plans with increased focus on NMDOH difficulty in capturing this information directly from patients, the CVC can serve as a proxy to understand the block level of factors affecting individuals and their families. This information can also help providers design holistic programs to more effectively address the complex needs of their patients, particularly with respect to barriers to healthcare access. For example, grouping diabetic patients into diabetes program cohorts with other patients who have high degrees of similarity across clinical, personal, and behavioral characteristics can facilitate stronger provider-to-patient and patient-to-patient connections and support.
Delivering Impact
Organizations are successfully and innovatively leveraging the CVC to improve health and well-being across communities. Examples of current uses of CVC delivering impact include:
• In addition to a CBO’s use of CVC to identify areas of high vulnerability and root causes of needs across a community, the CBO is integrating its own outcome measures/goals (e.g., greater health insurance coverage across its region of service) into the CVC and tracking progress (through KPIs) over a multi-year timeframe.
• As part of an upstream, community-wide program to improve pediatric asthma in high-risk neighborhoods, organizational stakeholders are leveraging the CVC to identify rising risk for asthma-related Emergency Department (ED) visits/hospitalizations among low-income children with asthma.
CVC is also integrated into the design of a single, community-wide, data-driven surveillance system to track and monitor pediatric asthma at the community, neighborhood, and individual levels. This will improve the capacity of community stakeholders (including providers) to incorporate upstream, contextual NMDOH factors and other important data into local policies, programs, and interventions to prevent ED visits and hospitalizations, close the asthma disparity gap, and meaningfully evaluate the impact of these efforts on the long-term health outcomes, quality of life, and care experience of children with asthma (and their families).
• Through use of patient-specific data via electronic health records (EHR) and NMDOH data via the CVC (as a proxy for individual data), a health system is grouping patients by their access and utilization of healthcare resources rather than by disease group in order to more fully understand access barriers of patient cohorts and their utilization patterns. The goal is to improve patient healthcare access by supporting and informing better design of clinical programs that enable new community partnerships and enhanced models for patient engagement, such as expansion of virtual engagement options.
• A provider is using CVC NMDOH insights (e.g., transportation challenges, internet connectivity, access to vital services) to determine, among other things, optimal locations for new community clinics serving vulnerable populations with advanced healthcare access issues.
• A health system and health department are analyzing (via side-by-side dashboards) CVC NMDOH data and chronic disease data to better understand the specific NMDOH factors impacting disease prevalence and then design and drive improved care programs to that cohort.
Methods
The CVC Leverages Curated NMDOH Data to Create Normalized, Comparable Insights
While the ideal state is to hear about NMDOH challenges directly from the affected individuals, it isn’t feasible to obtain this information at scale across communities. However, through research we know that NMDOH factors are personalized to neighborhoods and this information can serve as a reasonable proxy for individual specifics, as characteristics of a resident’s block (e.g., transportation challenges, lack of green space) closely represent the challenges that resident likely faces.
The CVC groups levels of vulnerability for each of its four subindexes and 26 indicators into quintiles from lowest to highest vulnerability (i.e., very high, high, moderate, low, very low). Users can identify and create a visual map of where targeted individuals reside, study the characteristics of their neighborhoods and underlying barriers to health (ranked highest to lowest) based on location, and then prioritize individual or community-based service support. At the geographic level, the CVC captures data with increasing granularity from the county, ZIP code, census tract, to the block-group level. Users can view the 26 specific clinical and NMDOH factors clustered by theme across the four subindexes aligning with the Healthy People 2030 framework. The subindexes include Household Essentials (e.g., food insecurity, paycheck predictability, health insurance coverage), Empowered People (e.g., mobility, internet connectivity, education), Equitable Communities (e.g., employment, housing, green space), and Good Health (e.g., chronic diseases, life expectancy, mental health). The CVC provides a score (Community Vulnerability Index/CVI) based on vulnerability for each individual indicator, aggregated factors across each of the four CVC subindexes, and a “rolled-up” single score across the targeted geographic area.
For its users, the CVC also provides a standard, single source of accurate, in-depth, real-time data that they can access, understand, disseminate, and act upon to ensure the most effective, coordinated, evidence-driven programs and the best possible health outcomes. Through the CVC’s four subindexes and 26 clustered indicators, provider and community-support networks can have a common starting point from which to incorporate NMDOH factors and other important data into programs (e.g., reduction in pediatric asthma) that operate further upstream to close disparities gaps and advance health equity. And through a common evaluation framework, these networks can quantify the impact of interventions against the changing NMDOH dynamics across a community in both the short-term (e.g., reduction in readmissions) and in the longer-term improvements in health outcomes.
Depending on their specific use cases and programming, organizations need access to different levels of geographic specificity. The CVC allows users to view its subindexes (and the composite indicators) at the county, ZIP code, census tract, and block-group levels. This flexibility to zoom up or down, depending on the use cases, allows users to more effectively address their unique challenges, especially given their finite resources.
In collecting the data from multiple data sources for the CVC, PCCI goes through a rigorous cleansing and quality assurance (QA) process to ensure the input data is complete and more robust than what users would obtain from publicly available websites. For example, PCCI uses data-science approaches to fill in missing values (e.g., computing a score based on averaging the values of the three closest neighborhoods). We also make needed QA adjustments, such as excluding those of retirement age when calculating unemployment or including both rental- and mortgage-related expenses when calculating costs associated with housing. PCCI has also validated the CVC against the gold standard Area Deprivation Index (ADI) and the CDC’s Social Vulnerability Index (SVI) to ensure the CVC is directionally aligned with other commonly used sources. Although the ADI is a well-known, powerful tool in capturing community need across a number of factors, it does so in the aggregate and does not enable users to drill down to the level of specificity needed across individual factors to more effectively inform the best, most holistic program or intervention design. Conversely, other tools such as the SVI do allow users to drill down for specificity across included factors but those factors don’t encompass the broader CVC range of risk factors impacting a community’s health. For example, the SVI factors focus on the attributes relevant to its purpose in planning for public health emergencies. While the CVC and SVI include some common indicators, the CVC is specifically designed, through its alignment with the Healthy People 2030 framework, to focus on the wider range of specific, actionable neighborhood risk factors known to influence the health of vulnerable populations.
Finally, the CVC allows for integration—using the existing CVC dashboard—of a user’s existing data to create new, custom indexes or models. For example, if an organization is tracking particular metrics for readmissions reduction, those metrics can be integrated into the CVC and tracked over time along with the existing CVC subindexes/indicators.
###
To download a PDF of the CVC Information Sheet, use the following: