New COVID-19 Analytics Dashboards Unveiled by Consortium of Healthcare and Data Experts Tracks Levels of Protection Against the Virus at the County Level

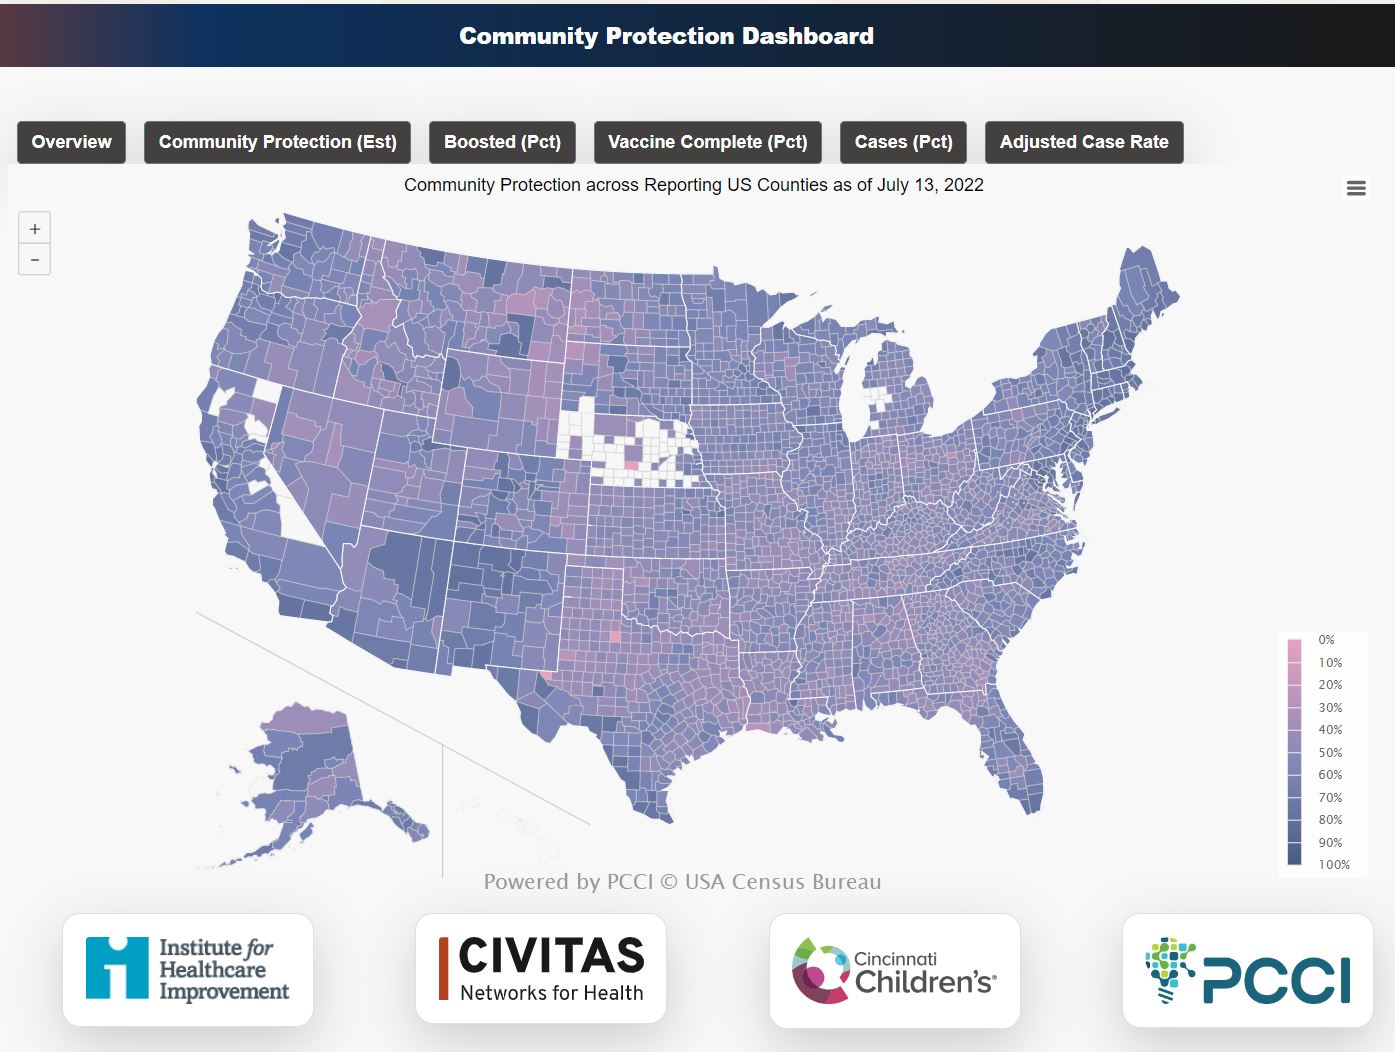
Data on COVID-19’s ever changing behavior and its potential impact at the county level is now available with the release of the national COVID-19 Community Protection Dashboard. Developed in a partnership between the Institute for Healthcare Improvement (IHI), Civitas Networks for Health (Civitas), Cincinnati Children’s Hospital (Cincinnati Children’s) and the Parkland Center for Clinical Innovation (PCCI), the COVID-19 Community Protection Dashboard is built from antibody prevalence surveillance, case reports, and counts of people with vaccinations series and boosters within a community.

The dashboard, available at: https://www.civitasforhealth.org/community-protection-dashboard/; offers an aggregate Community Protection Index (CPI) for nearly all of the counties in U.S. in the form of a score that combines multiple factors. These factors include the percent of the population that has received a booster dose; the percent of the population that have completed an initial vaccine series; the percent of cumulative reported cases and the percent of presumed cases.

The county-level CPI and core factors are available using a mouse-over interface on the dashboard’s map. The CPI is the score each county is given showing its population’s level of COVID-19 protection. A perfectly protected community would have a theoretical max score of 100. Currently observed national rates show an average CPI of 51.6. Nationally, the CPI range is between 41 to 83, showing a tremendous variation on the county-level. For example, Los Angeles County, Calif., that has a CPI of 70 based on its population being boosted, with 73 percent having completed its initial vaccine series as well as 30 percent reported infections and 63 presumed to be infected. Compare this to Fulton County, Ga., that reports a CPI of 59, due to lower boost percentage, 47, completed vaccination series, 47 and 20 percent reported cases and 73 percent presumed infections.

Dallas County has an overall index of 60, with 39% of population boosted.

“The goal of the analytics within the dashboard is to contextualize what it’s being observed locally to what is happening concurrently across surrounding counties, state and nation,” said Steve Miff, PhD, CEO and President at PCCI. “We intend for these insights to help provide a local dynamic vulnerability awareness with a national contextualization and use it to help identify emerging trends and forecast impact based on cross –region comparisons. Local cross-county/region collaboration and communication can also be enhanced with these additional insights.”

The collaboration of these healthcare and data analytics organizations has developed the dashboard with the goal of bringing together multiple sources of readily available COVID data and interpreting the information into a consistent and digestible way, including:

  • Taking into account the strong immunity from recent vaccination, but factoring the impact of waning immunity over time and the characteristics of the most recent variant
  • Weighting the extra protection from booster vaccination against new variants
  • Acknowledging the contribution from nature immunity
  • Including estimates of hybrid immunity

“There is a correlation with the CPI and recent hospitalization population rates, but the application is not a predictive model, it is a tool to foster community awareness that protecting a community from serious comorbidity and systemic stress on hospitalization requires vigilance,” said Dr. Holt Oliver, PCCI’s Vice President of Medical Informatics. “Even though the seroprevalence of protective antibodies is in the high 90%, as we go in to our first fall and winter infectious season with protection that for many Americans is waning, the value of continuing this conversation will be increasingly important.”

This effort has been part of a larger initiative led by IHI with its lead partner, Civitas.  In Phase 1 of the initiative, the IHI-led team implemented a rapid innovation cycle to learn from early experiences, scan emerging best practices and challenges, and develop a model for mounting a rapid local response to the U.S. vaccine crisis. Initial research conducted by IHI, The Health Collaborative, PCCI/Parkland Health and Cincinnati Children’s produced a vaccine implementation and delivery model as well as a set of change theory ideas for testing and scaling vaccine distribution in defined local populations.

In Phase 2, the initiative engaged in qualitative interviews with health departments and Health Information Exchanges (HIEs), which included Nebraska, North Carolina, Maryland, Texas and Indiana, to better understand how data has been used to support public health efforts during the Covid-19 pandemic. Through the work done in Phases 1 and 2, the COVID-19 Community Protection Dashboard prototype has been developed to support data sharing. A number of other deliverables and publications are in process and will be shared at various Civitas events, at the IHI Annual Conference and in upcoming journal articles and various publications.

“The availability of community-based tools, fed with local data, is key to local decision making. By mapping where pockets of vulnerability exist and how immunity likely changes over time, it becomes possible to target resources to better keep communities safe,” said Dr. David Hartley, an epidemiologist at Cincinnati Children’s. “This work illustrates how to do just that.”

About Civitas Networks for Health

Civitas Networks for Health is a mission- and member-driven organization dedicated to using health information exchange, health data and multi-stakeholder, cross-sector approaches to improve health. It was formed in October 2021 with the affiliation of the Strategic Health Information Exchange Collaborative (SHIEC) and the Network for Regional Healthcare Improvement (NRHI). Civitas Networks for Health counts more than one hundred regional and statewide health information exchanges (HIEs), regional health improvement collaboratives (RHICs), quality improvement organizations (QIOs) and all-payer claims databases (APCDs) as well as more than 50 affiliated organizations as members and reaches approximately 95 percent of the United States population. To learn more, please visit www.civitasforhealth.org.

About the Institute for Healthcare Improvement (IHI)

The Institute for Healthcare Improvement (IHI) is an independent not-for-profit organization based in Boston, Massachusetts, USA. For 30 years, IHI has used improvement science to advance and sustain better outcomes in health and health systems across the world. IHI brings awareness of safety and quality to millions, catalyzes learning and the systematic improvement of care, develops solutions to previously intractable challenges, and mobilizes health systems, communities, regions, and nations to reduce harm and deaths. IHI collaborates with a growing community to spark bold, inventive ways to improve the health of individuals and populations. IHI generates optimism, harvests fresh ideas, and supports anyone, anywhere who wants to profoundly change health and health care for the better. Learn more at ihi.org

About Cincinnati Children’s

Cincinnati Children’s ranks among the top five in the nation in U.S. News & World Report’s 2021-22 listing of Best Children’s Hospitals. A nonprofit, academic medical center established in 1883, Cincinnati Children’s is one of the top three recipients of pediatric research grants from the National Institutes of Health. The medical center is internationally recognized for improving child health and transforming delivery of care through fully integrated, globally recognized research, education, and innovation. Additional information about technologies developed at Cincinnati Children’s may be found at Innovation.CincinnatiChildrens.org

About Parkland Center for Clinical Innovation

Parkland Center for Clinical Innovation (PCCI), founded in 2012, is celebrating a decade as a not-for-profit, healthcare innovation organization affiliated with Parkland Health. PCCI leverages clinical expertise, data science and social determinants of health to address the needs of vulnerable populations.


###

DCEO Healthcare: Info Envy: Dallas County’s Public Health Data Is Among the Best in the Country

One of Dallas’ top media outlets, D CEO Healthcare, ran a story on the reaction to PCCI, IHI and the Cincinnati Children’s Hospital Medical Center publishing an article in the New England Journal of Medicine on PCCI’s herd immunity program for Dallas County:

“Dallas County is home to some of the best COVID-19 data in the country. So when Steve Miff met with experts from Cincinnati Children’s Hospital Medical Center to publish his recent paper in the New England Journal of Medicine about herd immunity, he found that his out-of-town colleagues were jealous of the depth and breadth of information.” 

Go here to read the full article: https://www.dmagazine.com/healthcare-business/2021/09/info-envy-dallas-countys-public-health-data-is-among-the-best-in-the-country/

D Magazine: Dallasites Are Now Six Times More Likely to Get COVID-19

The average Dallas resident is now 600 percent more likely to catch COVID-19 than they were in early June, according the Parkland Center for Clinical Innovation’s COVID-19 Vulnerability Index. Low vaccination rates and rising cases, primarily driven by the delta variant, have created the aggregate increase in vulnerability between the end of June and the end of July.

READ MORE HERE:
https://www.dmagazine.com/healthcare-business/2021/08/dallasites-are-now-six-times-more-likely-to-get-covid-19/

PCCI’s Vulnerability Index: Delta Variant Increasing Ongoing COVID Risk by 600 Percent

DALLAS – Due to low vaccination levels and new COVID-19 cases in Dallas County, the Parkland Center for Clinical Innovation’s COVID-19 Vulnerability Index has recorded a 600 percent aggregate increase between the end of June and the end of July 2021, primarily driven by the fast-spreading COVID-19 Delta variant.

The ZIP code with the highest Vulnerability Index, 75228, in East Dallas bordered by Interstates 30 and 635 and intersected by Highway 12, has a 19.76 vulnerability rating as of July 27, an increase of 17.95 over June 27. The ZIP code with the second highest Vulnerability Index rating, 75243 east of Highway 75 and intersected by Interstate 635, has a 19.66 vulnerability rating, an increase of 16.01 from June 27. The growth in these areas highlight increasing risk for Dallas County.

“Vaccinations help prevent the spread and reduce mortality of COVID-19,” said Thomas Roderick, PhD, Executive in Residence at PCCI. “Our latest Vulnerability Index report shows that COVID-19 risk is increasing, with new cases rising sharply among the unvaccinated. It is important to get the vaccine if you are medically able to do so, both for yourself, your young children, and for your neighbor who may not be able to receive a vaccination.”

One of the hardest hit ZIP Codes during the past year is 75211, which includes the areas around Cockrell Hill and Oak Cliff, which has a vulnerability rating of 14.75. It continues to be in the top 10 most vulnerable ZIP codes, though still far below its high of 157.96 registered in January 2021.

Launched in June of 2020, PCCI’s Vulnerability Index identifies communities at risk by examining comorbidity rates, including chronic illnesses such as hypertension, cancer, diabetes and heart disease; areas with a high density of populations over the age of 65; and increased social deprivation such as lack of access to food, medicine, employment and transportation. These factors are combined with behavioral

factors such as vaccination rates and confirmed COVID-19 cases where a vulnerability index value is scaled relative to July 2020’s COVID-19 peak value. The PCCI COVID-19 Vulnerability Index can be found on its COVID-19 Hub for Dallas County at: https://covid-analytics-pccinnovation.hub.arcgis.com/.

“Without question, vaccinations are the key to Dallas County getting through the Delta surge and hopefully ending the pandemic,” said George “Holt” Oliver, MD, Vice President of Clinical Informatics at PCCI. “The vaccinations for adults and children over 12 years old, are effective, easily obtained and quickly administered. We should all do our part to get vaccinated and encourage others to do the same. That is the way we will crush COVID.”

Data Sources:
To build Vulnerability Index, PCCI relied on data from Parkland Health & Hospital System, Dallas County Health and Human Services Department, the Dallas-Fort Worth Hospital Council, U.S. Census, and SafeGraph.

About Parkland Center for Clinical Innovation
Parkland Center for Clinical Innovation (PCCI) is an independent, not-for-profit, healthcare intelligence organization affiliated with Parkland Health & Hospital System. PCCI leverages clinical expertise, data science and social determinants of health to address the needs of vulnerable populations. We believe that data, done right, has the power to galvanize communities, inform leaders, and empower people.

###

PCCI COVID-19 Update: Vaccinations Help Dallas County’s COVID-19 Risk Drop 40 Percent in May

DALLAS – Due to vaccination levels and reduction in new COVID-19 cases in Dallas County, the Parkland Center for Clinical Innovation’s COVID-19 Vulnerability Index has recorded a 40 percent drop in average vulnerability from April to the end of May.

The Vulnerability Index decrease can be attributed to a moderate increase in vaccines, a 10 percent increase in vaccinated people (partial or complete) month over month, and a 37 percent decrease in active cases.

The ZIP code with the highest Vulnerability Index, 75243, has a 12.20 vulnerability rating, however that was a decreased by 61 percent from April. This decrease was driven by vaccinations.

Most vulnerable zip codes. The cases have continued to reduce substantially month-over-month. (See list below)

“Thanks to the vaccination programs implemented throughout Dallas County, we continue to see progress in our fight against COVID-19,” said Thomas Roderick, PhD, Executive in Residence at PCCI. “Our latest Vulnerability Index report is the most positive yet, with new cases slowing and modest, but important participation in the vaccination program continuing. This progress is a credit to the outstanding efforts of our public health leaders and residents devoted to crushing COVID.”

One of the hardest hit ZIP Codes during the past year, 75211, which includes the areas around Cockrell Hill and Oak Cliff, continues to be in the top 10 most vulnerable ZIP codes, however, its May rating of 9.63, is a massive improvement over its high of 196.9 in January.

Launched in June of 2020, PCCI’s Vulnerability Index identifies communities at risk by examining comorbidity rates, including chronic illnesses such as hypertension, cancer, diabetes and heart disease; areas with a high density of populations over the age of 65; and increased social deprivation such as lack of access to food, medicine, employment and transportation. These factors are combined with dynamic mobility rates and confirmed COVID-19 cases where a vulnerability index value is scaled relative to July 2020’s COVID-19 peak value. The PCCI COVID-19 Vulnerability Index can be found on its COVID-19 Hub for Dallas County at: https://covid-analytics-pccinnovation.hub.arcgis.com/.

Recently, PCCI revised its COVID-19 herd immunity forecast, 80 percent of residents either having recovered from COVID-19 or having received a vaccination, from mid-June to July, due to a slowing rate of immunizations. However, as of the end of May, Dallas County is closing in on the 80 percent goal, at 75.5 percent herd immunity.

“Without question, vaccinations are the key to Dallas County reaching herd immunity,” said George “Holt” Oliver, MD, Vice President of Clinical Informatics at PCCI. “Vaccinations have been the primary reason we’ve seen a reduction in risk and why we are in sight of reaching the herd immunity threshold. The vaccinations for adults and children over 12 years old, are effective, easily obtained and quickly administered. We should all do our part to get vaccinated and encourage others to do the same. That is the way we will crush COVID.”

Data Sources:
To build Vulnerability Index, PCCI relied on data from Parkland Health & Hospital System, Dallas County Health and Human Services Department, the Dallas-Fort Worth Hospital Council, U.S. Census, and SafeGraph.

About Parkland Center for Clinical Innovation
Parkland Center for Clinical Innovation (PCCI) is an independent, not-for-profit, healthcare intelligence organization affiliated with Parkland Health & Hospital System. PCCI leverages clinical expertise, data science and social determinants of health to address the needs of vulnerable populations. We believe that data, done right, has the power to galvanize communities, inform leaders, and empower people.

###

Herd Immunity Forecast For Dallas County Pushed Back to Late July

  • More natural immunity; decreasing vaccination rates   
  • Data from new UT Southwestern seroprevalence study raises PCCI’s county wide previously infected estimates to 48% of the total population;   
  • Herd immunity rate increases to 74 percent of the total population 
  • PCCI now forecasts Dallas County to surpass COVID herd immunity by late July 

Parkland Center for Clinical Innovation (PCCI) has updated its herd immunity forecast for COVID-19 in Dallas County. The new herd immunity analysis includes the up-to-date vaccination percentages for Dallas County as well as a change in the percentage of residents confirmed and presumed to have been infected. These factors indicate that the county’s herd immunity rate is now 74 percent of the total population. However, a continued decrease in vaccinations pushes reaching the herd immunity threshold of 80 percent of all residents either having been infected or being vaccinated towards late July. 

PCCI made its initial herd immunity forecast for Dallas County in February, where it predicted the county would reach the herd immunity threshold by mid-June.  

 “The most critical factor in the fight to crush COVID remains vaccinations for the whole population, particularly with the county’s younger, working population and the recently approved high school and middle school students,” said Steve Miff, PhD., PCCI’s President and CEO. “Convenience, missed work or school from vaccine side-effects, and concerns about providing identifications for the transient and un-documented populations remain as key barriers to vaccinations and continue to be a key decision driver for the 20-30 percent of the unvaccinated population who are not opposed to receiving a vaccine, but have not yet rolled up their sleeves.” 

 An important new UT Southwestern virologic study indicates a ratio of 1:4 for confirmed positive (tested and confirmed) to presumed infected (positive antibodies, but never tested) population for Dallas County.  With this information, PCCI has updated the presumed infected adult population from a 1:3 ratio to the 1:4 ratio. This increase in the presumed infected results also in adjustment of the vaccinated population of Dallas estimated to have had prior COVID-19 infection and recovered from 21 percent to 28 percent.   

 For vaccinations, the weekly average is slowing below 15,000 first doses/week despite new age group approval for 12-15-year-old. To date, 1,018,696 people in Dallas County have been vaccinated, with 798,775 being fully vaccinated.  This indicates that approximately 40 percent of the whole county population, 52 percent of the over 18-year-old population, and 77 percent of the over 65-year-old have received at least one dose of the vaccine.   

The net results increase the current county wide herd immunity rate to 74 percent of the total population.  Twenty-six Dallas County ZIP codes are estimated as surpassing the 80 percent threshold to date.  


 Figure Above: COVID-19 Herd Immunity Current State, Dallas County, May 13, 2021; base population based on US Census ACS 2019 5 year; values capped at maximum of 0.8 to show relative progress; eastern zip codes in county tend to be sparser and cover a larger area; estimates may have variance across county estimates; using 4x AIRR based on UTSW seroprevalence data as best local estimate. Overlap estimate of 28% of vaccinated population of Dallas estimated to have had prior COVID-19 infection and recovered. 

 Significant plans are already underway to address convenience and access. PCCI has created an updated Vulnerability Index calculation and identified the top 100 neighborhoods with the most unvaccinated individuals (map below).  The map shows areas of low vaccination rates sprinkled across north and central Dallas County, but it indicates large sections of the southern half of the county have many unvaccinated. These areas in south Dallas often experience transportation gaps to access certain vaccination sites.  

Dallas County, City of Dallas and the Parkland Health and Hospital System are coordinating efforts to bring local community vaccination clinics to high risk, high opportunity locations.  There are 29 recent, active, and planned community locations to where individual can receive a COVID vaccine in their own neighborhood.   These are in addition to the local pharmacies, physician offices and other activities by many local health systems.   


Above Image: The dotted red areas indicate neighborhoods with highest numbers of unvaccinated individuals. 

“With this new analysis, we are able to pinpoint where the least vaccinated populations are in the county,” said Dr. Miff. “Our public health leaders are taking action and making progress toward reaching those areas, but each of us can take responsibility to quickly receive our vaccine and encourage our friends and neighbors to do the same, especially for those who live in neighborhoods with the low vaccination rates. Vaccines are the fastest and safest way we can get back to any sort of normal.” 

Why does it matter that we get to herd immunity through vaccinations instead of infection? 

Reaching herd immunity will significantly reduce the spread of the virus but reaching the 80 percent with equal numbers of vaccinated and natural immunity populations will not make the virus go away. For areas already at or above 80 percent, and for the rest of the county, until vaccination rates increase, there will likely continue to be low levels of constant infections, hospitalizations and periodic deaths.   

 “The virus will continue to linger in the background at relatively low and steady rates, with the periodic flareup. The best thing we can do is continue to vaccinate to reach and surpass the 80 percent vaccination mark and then drive both personal and community protection through the vaccines,” said Dr. George ‘Holt’ Oliver, Vice President of clinical Informatics at PCCI. 

 For more information about how PCCI has taken the fight to COVID-19, go to: https://pcci1.wpengine.com/taking-the-fight-to-covid-19/. 

 About Parkland Center for Clinical Innovation  

Parkland Center for Clinical Innovation (PCCI) is an independent, not-for-profit, healthcare intelligence organization affiliated with Parkland Health & Hospital System. PCCI leverages clinical expertise, data science and social determinants of health to address the needs of vulnerable populations.   


### 
Updated PCCI Vulnerability Index Highlights Progress, but Ongoing At-Risk Communities

By Thomas Roderick, PCCI’s Executive in Resident
& George “Holt” Oliver, MD, PhD, Vice President, Clinical Informatics

Why this post

More than a year ago, the data scientists at Parkland Center for Clinical Innovation (PCCI) committed to take the fight to COVID-19 by assisting North Texas residents, community leaders and public health officials through delivering actionable pandemic intelligence.

Many of us at PCCI and in the community have suffered the loss of family members, colleagues, coworkers, neighbors and friends. So with great relief we have witnessed tremendous scientific achievements in the development, approval and distribution of COVID-19 vaccines within a year. We have also seen the community evolve and adapt to life with COVID-19 and the actions expand from initial testing strategies to vaccine deployment, herd immunity projections and tracking, to now overcoming vaccination hesitancy and surveillance tracking of emerging variants, re-infections and individual/community immunity.

As our community and pandemic efforts evolve, so does the intelligence it needs. To meet that need, PCCI is evolving its technology and is pleased to announce the next phase of the Vulnerability Index.

What is the Vulnerability Index?

The Vulnerability Index is a measure of risk a community faces due to COVID-19. Higher risk means that people may be more likely to be infected with COVID-19, and if they do, they are more likely to experience symptoms and potentially face hospitalization and even death.

When the Vulnerability Index was first built, it covered factors correlated with COVID-19, including attributes in the community that don’t change quickly (like proportion of elderly population, people living with chronic conditions that are associated with COVID-19, and social determinants of health) as well as dynamic factors that increase immediate risk, like active COVID-19 cases and the mobility of the people living in the community.

How has the Vulnerability Index changed?

The North Texas community has evolved in two very important ways, and so the Vulnerability Index is changing as well.

    • First, as with the rest of the world it has adopted mask-wearing, social distancing, hand washing, and other hygiene and behavioral recommendations from public health authorities to limit the spread of COVID-19. Combined with the full opening of the economy, this means that a mobility factor has less relevance in identifying risk, because people change their behavior when they are out shopping at the grocery store, working, visiting parks, and otherwise engaging in the community. Without these behavior adjustments, mobility would continue to be important to monitor and understand, but not a critical factor in predicting neighborhood vulnerability.
    • Second, the introduction and uptake of the vaccine has started the process of lifting communities to herd immunity (HI), which is where the virus has a hard time finding people to infect because enough people have antibodies. As more people get vaccinated, there are fewer people in the community to become infected, and the community is less vulnerable.

An important caveat is that COVID-19 variants can continue to arise. PCCI is conducting ongoing surveillance on reinfections across Dallas County to assess the emergence of new variants, transmission and potential drop off of previously developed immunity. If this happens it means the mediating effect of the vaccination against COVID-19 risk may be decreased – so more people face infection risk. This is also captured in the updated Vulnerability Index.

How is the Vulnerability Index used?

The Vulnerability Index is used to inform how the communities and municipalities across Dallas County coordinate efforts to improve access to testing, vaccinations and create a path towards herd immunity. Below is a balloon plot, which shows cases on the horizontal axis and vaccinations on the vertical axis. It highlights HI progress in early April for ZIP codes across Dallas County. Each circle represents the current progress; each tail shows the improvement over two weeks. Upward “balloon” trajectory is favorable as it indicates that improvement was a result of vaccinations, not infections.

Source: The Parkland Center for Clinical Innovation

One thing that immediately jumps out is that ZIP codes with higher static vulnerability (or long-term risks in a community that do not change quickly such as age, medical comorbidities and social/economic factors) were slower at vaccine uptake. A potential reason for this is social determinants of health (SDOH) – people who live in these zip codes may be in jobs that are not conducive to have the ability to take time off from work and to travel to vaccine sites to be vaccinated. This information is used by community organizers, public health officials, and health care providers to coordinate efforts and target each community in a way that removes barriers to vaccinations and target information and education via convenient and trusted sources.

Excelsior!

Ongoing vigilance against the virus remains key, and this includes getting vaccinated at your first available opportunity. As we enter the second summer in the pandemic, we at PCCI are committed to monitoring for COVID-19’s continued impact on the community, whether through improving the view into impacted communities, the impact of variants, reinfection risk, and more.

For more information about how PCCI has taken the fight to COVID-19, go to: https://pcci1.wpengine.com/taking-the-fight-to-covid-19/

###

PCCI’s Vulnerability Index Records 66 Percent Reduction in COVID-19 Risk for Dallas County

DALLAS – Dallas County saw a massive 66 percent reduction in risk values recorded by PCCI’s COVID-19 Vulnerability Index in February, with some of the most vulnerable ZIP codes showing significant reductions.

One of the hardest hit ZIP Codes, 75211, which includes the areas around Cockrell Hill and Oak Hill, saw its vulnerability risk value drop by 151.9 points, going from 196.9 vulnerability rating in January to 44.9 in February. The 75211 ZIP code remains the second most at risk area in Dallas County, however its overall improvement is a positive sign for the hard-hit area.

“The dramatic drop in the county’s vulnerability is positive and offers a hopeful path going forward,” Thomas Roderick, PhD, Senior Director of Data and Applied Sciences at PCCI. “We are remaining cautious as we saw vulnerability rates come down

last summer only to see increase significantly later. The key to continued reduction of vulnerability is ongoing vigilance, including continued adhering to local health official guidance, social distancing, face covering, and registering for vaccinations as soon as you’re able.”

Launched in June of 2020, PCCI’s Vulnerability Index identifies communities at risk by examining comorbidity rates, including chronic illnesses such as hypertension, cancer, diabetes and heart disease; areas with a high density of populations over the age of 65; and increased social deprivation such as lack of access to food, medicine, employment and transportation. These factors are combined with dynamic mobility rates and confirmed COVID-19 cases where a vulnerability index value is scaled relative to July 2020’s COVID-19 peak value. The PCCI COVID-19 Vulnerability Index

can be found on its COVID-19 Hub for Dallas County at: https://covid-analytics-pccinnovation.hub.arcgis.com/.

In addition to the drop in 75211, the ZIP code 75204, in east downtown Dallas, saw a 104.4 drop in its vulnerability ratings. ZIP code 75224, in southern Dallas, saw a drop of 64.9 in its vulnerability ratings, but now is ranked as the most vulnerable area in Dallas County with a vulnerability value of 45.87. Also, the ZIP code 75227, in east Dallas County intersected by State Highway 12, is the third most vulnerable area in Dallas with a 42.45 value, though it dropped 70.5 in its vulnerability ratings since January.

“Holidays and events are potential super-spreader events,” said Dr. Roderick. “We are in a time of year where these tend to

be limited, which impacts ongoing COVID-19 cases. However, Spring Break and occasional holidays on the calendar represent potential trouble times. PCCI will continue monitoring for things that can push Dallas County into higher levels of vulnerability.”

PCCI recently forecast that Dallas County may reach COVID-19 herd immunity by mid-June. This, Dr. Roderick points out, is only possible though vaccinations.

“We each need to be patient as well as register and receive our COVID-19 vaccination,” said Dr. Roderick. “The only way we will reach herd immunity is by maintaining our vigilance and getting vaccinated. Reaching herd immunity is a community effort and should be a priority for each of us.”

PCCI recently launched the MyPCI App, another program to help inform the residents of Dallas County to their individual risks. The MyPCI App, free to register and use, is a secure, cloud-based tool that doesn’t require personal health information and doesn’t track an individual’s mobile phone data. Instead, it is a sophisticated machine learning algorithm, geomapping and hot-spotting technology that uses daily updated data from the Dallas County Health and Human Services (DCHHS) on confirmed positive COVID-19 cases and the population density in a given neighborhood. Based on density and distances to those nearby who are infected, the MyPCI App generates a dynamic personal risk score.

To use the MyPCI App, go to, https://pcci1.wpengine.com/mypci/, click on the link and register (Using code: GP-7xI6QT). Registration includes a request for individual location information that will be used only for generating a risk assessment, never shared. Once registered, simply login daily and a COVID-19 personal risk level score will be provided along with information to help individuals make informed decisions about how to manage their risk.

Data Sources:
To build Vulnerability Index, PCCI relied on data from Parkland Health & Hospital System, Dallas County Health and Human Services Department, the Dallas-Fort Worth Hospital Council, U.S. Census, and SafeGraph.

About Parkland Center for Clinical Innovation
Parkland Center for Clinical Innovation (PCCI) is an independent, not-for-profit, healthcare intelligence organization affiliated with Parkland Health & Hospital System. PCCI leverages clinical expertise, data science and social determinants of health to address the needs of vulnerable populations. We believe that data, done right, has the power to galvanize communities, inform leaders, and empower people.

###