In the News: PCCI Programs Included In List of Top Predictive Analytics Roundup
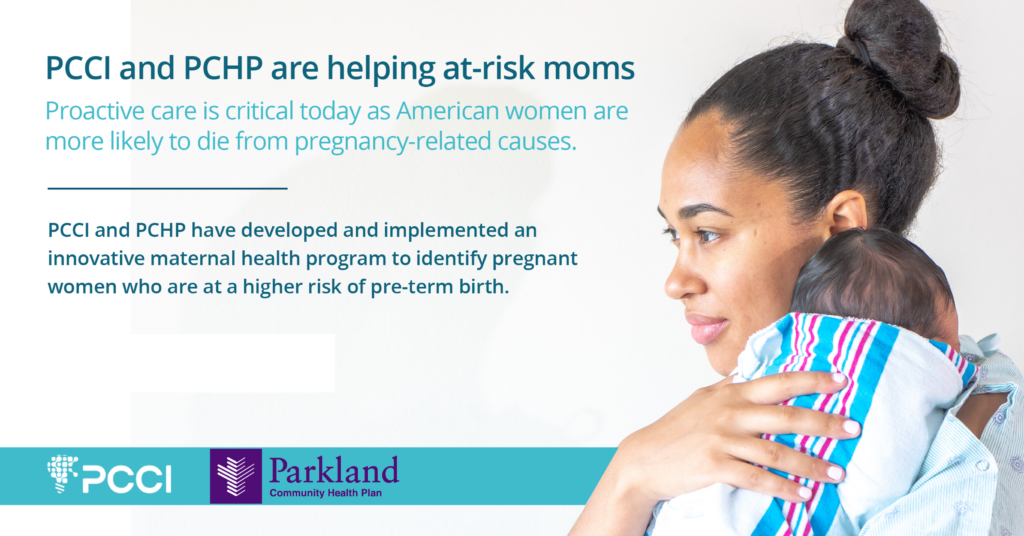
HealthIT Analytics included PCCI’s suicide screening and preterm birth prevention in its roundup story of “10 high-value use cases for predicative analytics in healthcare”
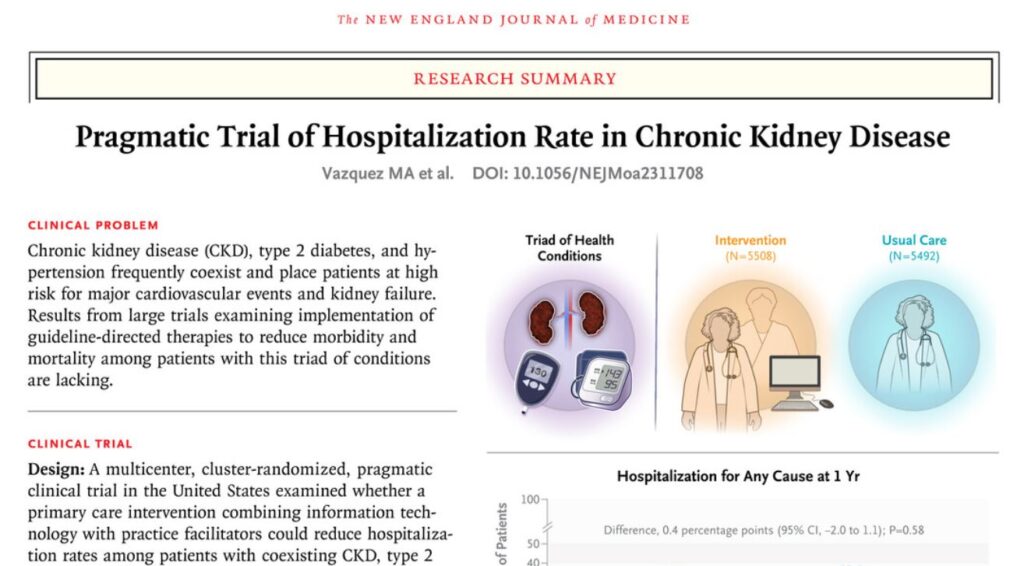
Publications: PCCI experts contribute to paper published by the New England Journal of Medicine (NEJM Group).
PCCI’s George Oliver, MD, PhD, Vice President, Clinical Informatics and Venkatraghavan Sundaram, PhD, M. Pharm, Program Manager, contributed to this paper, along with many others, on the “Pragmatic Trial of Hospitalization Rate in Chronic Kidney Disease.”
In The News: Health IT Analytics Takes a Deep Dive into PCCI’s Suicide Prevention Program
Recently, Health IT Analytics interviewed PCCI’s Jacqueline Naeem, MD, Senior Medical Director, and Kimberly Roaten, PhD, ABPP, professor in the Department of Psychiatry at University of Texas Southwestern Medical Center and associate chief quality and safety officer for Behavioral Health – Parkland Health about the suicide screening and prevention program that is being used in all of Parkland’s facilities.
Parkland Health & Hospital System (PHHS) and Parkland Center for Clinical Innovation (PCCI) in Dallas, Texas have successfully achieved this with their Universal Suicide Screening Program. Two experts from the initiative sat down to discuss the program’s hurdles, successes, and future plans in a recent episode of Healthcare Strategies.
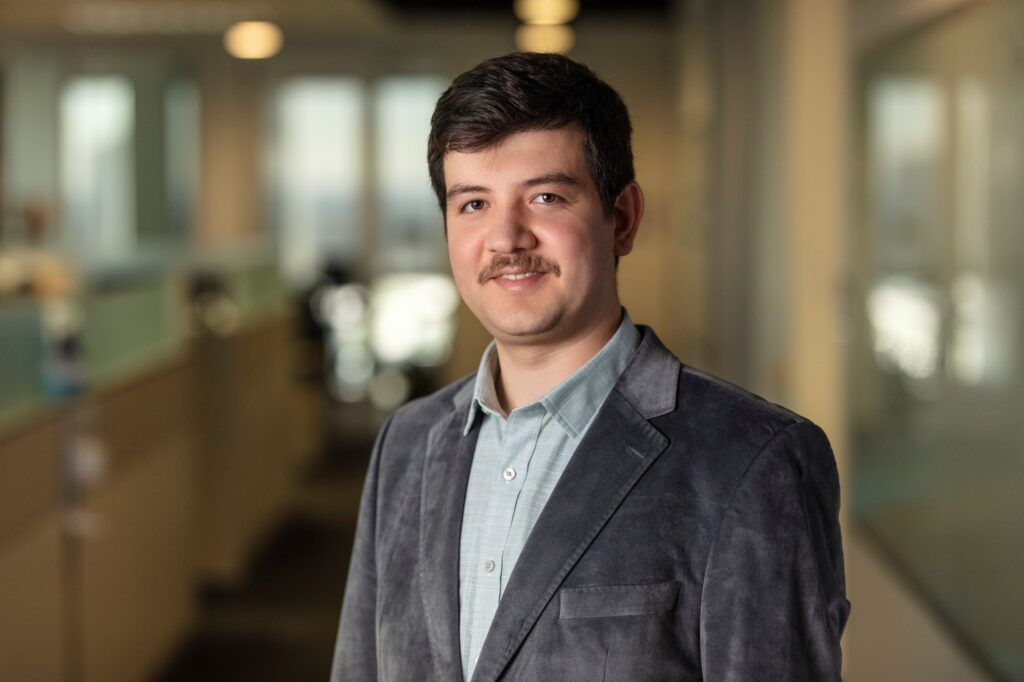
In the News: PCCI Data Scientist Talks With Healthcare IT News About Sepsis Prevention
Yusuf Tamer, PhD, principal data and applied scientist at the Parkland Center for Clinical Innovation, offers a sneak preview of his HIMSS24 session, which offers a detailed look at one of artificial intelligence’s most promising use cases.
In this video from the recent Invest Dallas-Fort Worth Launch Conference, PCCI’s CEO Steve Miff, PhD, moderated a panel, “Closing the Gap: How educators and healthcare professionals collaborate to improve healthcare outcomes, the talent gap, and workforce wellbeing.” This important panel discussed providing more access to care, the importance of unbiased data, and strategies to improve healthcare outcomes.
PCCI Sachs Summer Scholar Makes Forbes 30 Under 30 List
In its recently released 30 Under 30 List, Forbes Magazine included Meghna “Chili” Pramoda in its Education section for her part in helping found SafeTeensOnline. Pramoda was a member of PCCI’s 2022 class of Sachs Summer Scholars interns, a program focused on advancing women in data science. During her term, Pramoda and a partner worked with PCCI data scientists for their research on using Safegraph Visualization in PCCI’s Community Vulnerability Compass. To view her and her partner’s end of term presentation, go to the 1 hour, 8 minute mark of this video: https://www.youtube.com/watch?v=d3BJ3EZJoE4
In the Forbes article on Pramoda, she is lauded for developing a system to support her peers in owning their online presence, from Forbes:
Founded by Vinny Veeramachaneni in 2017 and now spearheaded by cofounders Meghna “Chili” Pramoda and her sister Siona “Dolly” Pramoda, SafeTeensOnline is a nonprofit that offers English and Spanish language education on digital safety, in addition to courses in coding and ethical hacking. The Pramoda sisters created STOCyberReady, an app that helps teens understand the impact of their digital choices by analyzing their cyber risk and offering educational tips to reduce risk. The app is currently being used in 34 schools with a tentative public release set for 2024. SafeTeensOnline has partnered with the Taco Bell Foundation, T-Mobile, and the Department of Homeland Security.
PCCI at the 2024 Healthcare Analytics Summit (HAS)
PCCI leaders will be presenting at this week’s 2024 Healthcare Analytics Summit (HAS) in Salt Lake City, Utah. In its tenth year, HAS 24 is the premier event showcasing data and analytics’ critical role in tackling some of healthcare’s greatest challenges. Join healthcare’s do-ers, hard workers, believers, game-changers, and impact-makers in Salt Lake City to leverage our collective expertise and experience to Imagine, Innovate, and Impact healthcare.
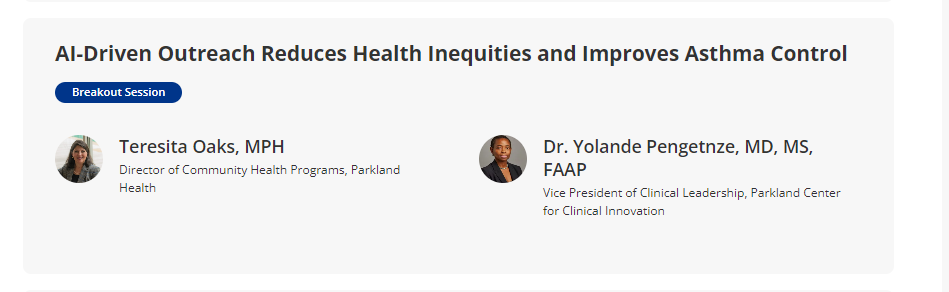
On Thursday, February 29 at the 9:10 a.m. to 10 a.m. breakout session, PCCI’s Yolande Pengetnze, MD, Vice President, Clinical Leadership and Parkland Health’s Teresita Oaks, Director, Community Health Programs will present information on Parkland’s groundbreaking pediatric asthma program.
Program overview
“AI-DRIVEN OUTREACH REDUCES HEALTH INEQUITIES AND IMPROVES ASTHMA CONTROL”
Asthma prevalence is surging, especially among children, with one in 12 children in the U.S. having asthma. Racial/ethnic disparities are concerning, as Black and Hispanic children experience higher asthma hospitalization rates than white children.
PCCI and Parkland Health leveraged artificial intelligence (AI) to reduce inequities for low-income pediatric patients with asthma. Analyzing diverse data sets, teams identified those at risk for asthma-related emergency department visits (ED) and hospitalizations. Collaborating with interdisciplinary community coalitions, they launched interventions: community outreach, asthma screening and referrals, digital outreach, home visits, and risk-driven clinical support. The interventions impacted thousands of patients and improved outcomes – home visits improved asthma symptom control by 26%, and digital patient engagement reduced ED visits for lower-asthma-related issues by 36%.
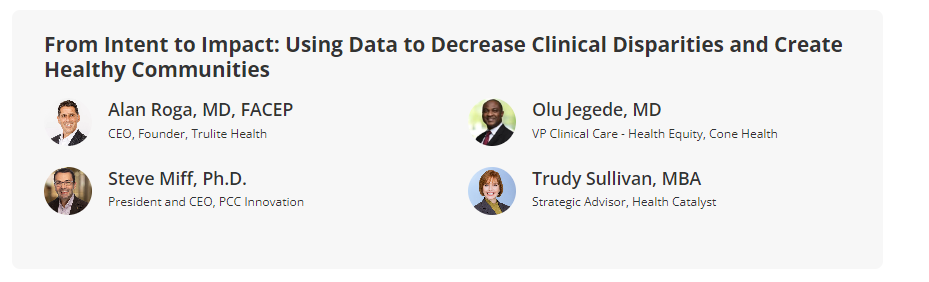
At the 10:20 a.m. to 11:10 a.m. breakout session, PCCI’s CEO, Steve Miff, PhD, joins a panel of experts to discuss how to bridge the gap of healthcare disparities.
Program Overview
FROM INTENT TO IMPACT: USING DATA TO DECREASE CLINICAL DISPARITIES AND CREATE HEALTHY COMMUNITIES
The economic burden of healthcare disparities in the United States is nearing $1 trillion and negatively affects millions of lives. However, there is a path forward, using data and analytics to understand the affected patient populations and the root causes of the issues.
Join this session to gain insights from a panel of industry experts. Learn how they have connected the community to the issue to improve overall health, created clinically focused equity platform and partnership, built a cohort of equity-focused partners, and more. This session will be particularly impactful if you lead quality, clinical improvements, or data science efforts.
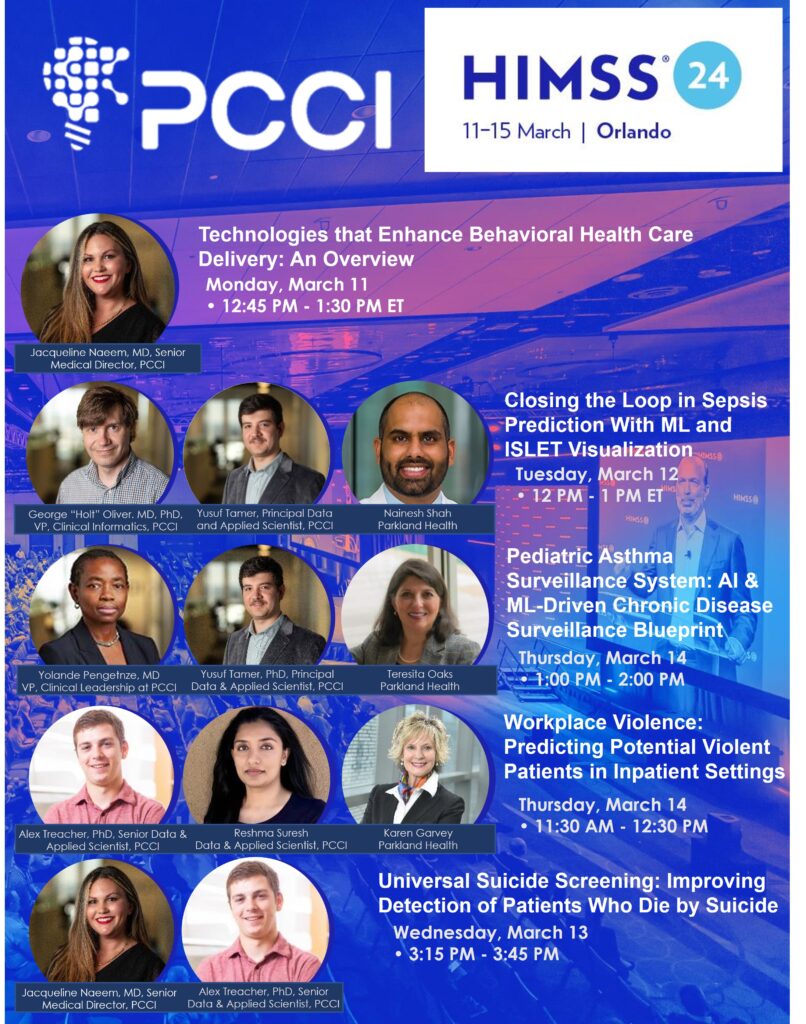
Suicide, a lack of psychiatric bed capacity, lack of access to psychiatry services, and other challenges are all too real in today’s healthcare environment. Using technology, however, to facilitate rapid diagnosis, treatment, and identification of resources is a welcomed relief to patients and clinicians alike. With a focus on various technologies, attendees will realize the difference that technology makes in the lives of patients and their families.
SPEAKERS:
Jacqueline Naeem, MD, Senior Medical Director at PCCI
While 80-85 percent of sepsis cases present within the first 48 hours of admission (ED), they have lower mortality (5-10 percent) as compared to 15-20 percent of cases that present later and have higher mortality (15-30 percent). To better (and earlier) identify sepsis cases not present on admission, at a large safety-net hospital, an end-to-end early sepsis prediction and response workflow was created in the inpatient setting. First, an ML model was built to predict the risk of a patient becoming septic in real-time. Next, the model baked into clinical workflows through FHIR APIs to make the model actionable at point of care. The model accesses EMR every 15 minutes and alerts the care providers when the risk exceeds a certain threshold, which can be tailored to local populations. Finally, an EHR-integrated decision support app (ISLET) was added to enable clinicians to easily view and understand model output to improve actionability. Prediction, alerting, visualizing the root causes and acting on the case completes the workflow. This full workflow has been running for thousands of patients every 15 minutes in the last year. This session will focus on the challenges, achievements and impact of this workflow on healthcare outcomes.
SPEAKERS:
George Oliver, MD, PhD, Vice President, Clinical Informatics at PCCI
Nainesh Shah, Assistant Professor, Health Informatician at Parkland Health
Yusuf Tamer, Principal Data and Applied Scientist at PCCI
The presenters built an AI- ML-driven pediatric asthma surveillance system (PASS) to monitor the clinical and social risk of pediatric asthma at the census tract level in Dallas County. First, they developed a novel AI/ML pediatric asthma risk index, combining clinical and social risk factors from multiple data sources to accurately predict census-tract risk of asthma-related emergency department visits and hospitalizations. Subsequent analyses identified actionable risk drivers which, combined with the novel asthma risk index, painted a wholesome, countywide picture of pediatric asthma risk disparities. PASS is an interactive, community-facing dashboard that maps and compares the distribution of the asthma risk index and other risk drivers across Dallas County. PASS is hosted on the Dallas County Health and Human Services website and is readily accessible to community stakeholders. Launched in January 2023, PASS was introduced to the community through training sessions and dissemination events to engage key stakeholders. PASS is being leveraged to advance health equity through diverse use cases ranging from environmental advocacy to city planning, clinical resources deployment, school-based interventions and corporate social responsibility. Lessons learned from PASS provide a blueprint for other scalable AI/ML-driven chronic disease surveillance systems such as diabetes and hypertension.
SPEAKERS:
Teresita Oaks, Director, Community Health Programs at Parkland Health
Yolande Pengetnze, MD, Vice President, Clinical Leadership at PCCI
Yusuf Tamer, PhD, Principal Data and Applied Scientist at PCCI
Occupational Safety and Health Administration (OSHA) defines workplace violence (WPV) as any act or threat of physical violence, harassment, intimidation or other threatening disruptive behavior occurring at work. Healthcare and social service workers are five times more likely to be injured than other workers and WPV rates continue to rise. Due in part to poor reporting systems, and the common misperception that violent events should be expected while working in healthcare, prevention measures rarely match the issue’s severity and often go unreported. This session will focus on efforts, in a large safety-net hospital, to address an important gap impacting WPV prevention efforts through the development of a predictive model to more accurately identify―in an inpatient healthcare setting―potentially violent patients, thus enabling healthcare workers to mitigate risks of impending WPV incidents.
SPEAKERS:
Karen Garvey, Vice President, Safety and Clinical Risk Management at Parkland Health
Alex Treacher, PhD, Senior Data and Applied Scientist at PCCI
Reshma Suresh, MS/MA, Data and Applied Scientist at PCCI
U.S. suicide rates increased by 27.6 percent over the past 15 years and suicide remains a leading U.S. cause of death, with 48,183 deaths in 2021, according to the CDC’s National Center for Health Statistics and the United Health Foundation. Development of evidence-based practices has dramatically increased over the past 20 years; however, suicide rates continue to increase in part due to broad variability in adoption of, and consistent adherence to, suicide prevention practices. As a vital first step in understanding suicide prevention from a population health perspective, and improving risk recognition for treatment application, a large safety-net hospital implemented a universal suicide screening program (SSP) in 2015, in which all patients ages 10 and older are screened for suicide risk during every provider encounter. This session will determine if the SSP reduces the number of patients falsely identified as not at risk of death by suicide in our cohort by linking mortality data to healthcare utilization data from five years pre- and post- SSP implementation. Despite suicide being a relatively low base-rate event (13-14/100,000 in the U.S.), the massive dataset size provides enough power for statistically meaningful changes to be detected.
SPEAKERS:
Jacqueline Naeem, MD, Senior Medical Director at PCCI
Alex Treacher, PhD, Senior Data and Applied Scientist at PCCI