Join PCCI’s Mission to Support the Most Vulnerable in Our Community through the North Texas Giving Day
On Thursday, September 18, 2025, PCCI is participating in Communities Foundation of Texas’ North Texas Giving Day, an online giving extravaganza for non-profit organizations from the whole region. We’re raising funds to further our mission to support the health of vulnerable communities in North Texas through the responsible applications of AI and non-medical drivers of health (NMDoH) analytics, and your gift helps make this possible!
Additionally, your support will benefit PCCI’s women in data science intern program, the Sachs Summer Scholars. PCCI developed this STEM-focused program to help open doors to women seeking careers in data science. This is an industry challenge as, according to Girls Who Code, from 1984 to today, the number of female computer science graduates dropped from 37% to 18%. At PCCI we are committed to reversing this trend in the data science and technology industry all while focusing the intern’s contributions, efforts and learnings towards innovative, practical solutions supporting our local community.
Through early giving, you can make your North Texas Giving Day contribution now! The platform makes it simple and easy to give. Between now and September 18, you can make your gift online at NTGD-PCCI.
Save the Date for September 18, when you can follow along by checking the North Texas Giving Day leaderboards, prizes page, and social media channels for exciting updates and announcements.
Thanks for your support of PCCI and for being a part of the North Texas Giving Day movement!
PCCI’s Community Vulnerability Compass Delivers Actionable Data to Municipal, Community-Based Organizations and Healthcare Providers
By Lance Rather, Senior Director, Product & Strategic Partnerships, PCCI
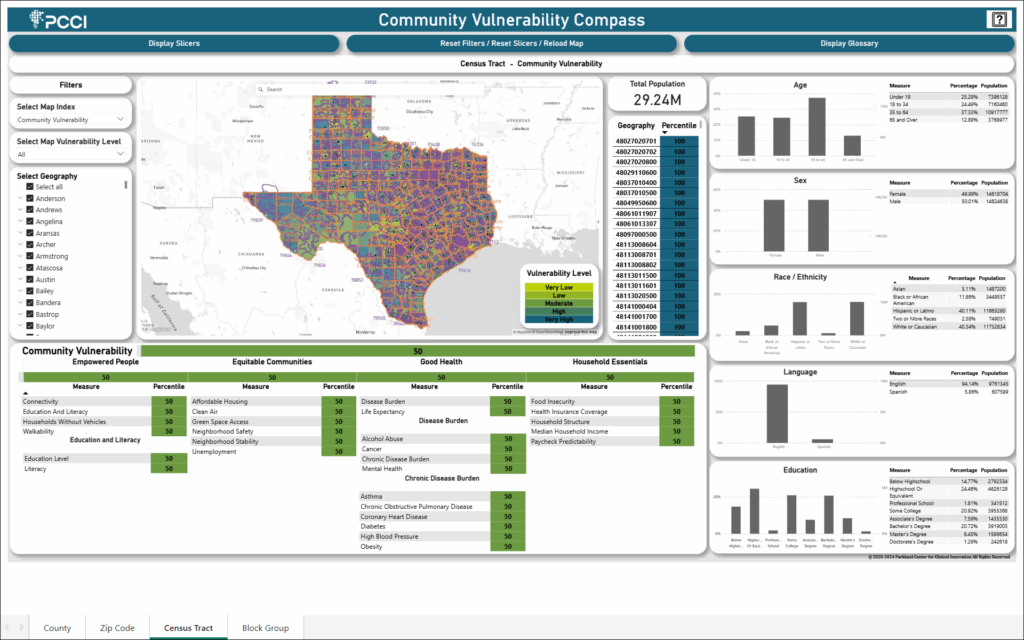
My goal, as part of a healthcare innovation organization, has always been to find factual and data-backed understanding of the community I’m trying to serve. At PCCI, we focus on finding opportunities to support vulnerable populations through actionable data. With our Community Vulnerability Compass (CVC), we’ve been able to go beyond assumptions and deliver hard facts about the health of our community. Currently, hundreds of organizations around the state are either using or are set to receive access to the CVC where they can leverage powerful, data-driven insights.
Since its creation, we have been able to use the CVC in a variety of ways to reveal actionable insights about the health of communities around Texas. PCCI’s CVC provides an interactive dashboard that helps stakeholders—including community-based organizations (CBOs), safety-net hospitals, health systems, philanthropic organizations, governmental agencies, universities, and managed care organizations (MCOs)—to make informed decisions that enhance health outcomes and drive equity in service delivery. The CVC breaks through “what we think we know” to provide hard facts, including root causes of the overall state of any given area down to the block group.
Using Dallas County as a test case, we demonstrated how the CVC can surface community needs in relation to the area’s socioeconomic realities. For example, we examined the mental health state of Dallas County and the CVC found the areas of the county that have historically faced economic challenges were also the most vulnerable to mental health issues.
The CVC was also able to break through assumptions about communities experiencing high social or structural barriers. We found that in Dallas County, regardless of the economic condition, low vulnerable ZIP Codes had high vulnerability neighborhoods and high vulnerable ZIP codes had low vulnerability neighborhoods. In some areas you could see a high or low vulnerability area separated by a single street. This provides our community leaders an opportunity to reach all vulnerable areas, and it offers root cause insights into a neighborhood’s vulnerability. These insights allow us to appreciate the individual strengths of each area in our communities.
PCCI also conducted a full vulnerability assessment of the five largest counties in Texas (Bexar, Dallas, Harris, Tarrant and Travis counties) where we found more than 4.2 million residents live in high or very high vulnerability block groups. We learned that Bexar County had the most vulnerable block groups of the five counties where the most prominent root cause for its vulnerability is neighborhood safety, followed by chronic diabetes and households without vehicles. Additionally, the largest county, Harris, had the second most vulnerable block groups, but also had the highest number of low vulnerable block groups, with the most vulnerable block groups indicators being Neighborhood Safety, followed by Health Insurance Coverage and Mental Health.
These assessments are powerful examples of how the CVC is helping us gain a better understanding of our communities and the variety of root causes that drive the vulnerabilities throughout the state. Beyond analysis, we are seeing the CVC used in practical daily uses that have a direct impact on our residents.
For example, PCCI’s CVC has been incorporated into a variety of solutions throughout Texas, including adoption across the Parkland Health system, by the Dallas County Department of Health & Human Services, the University Heath (San Antonio) Transplant Center. Beyond dashboard access, for larger organizations, we offer the ability to reverse geocode individual-level data and append block group–level CVC insights. These insights can be integrated directly into electronic health records or customer relationship management systems, allowing organizations to use localized non-medical drivers of health (NMDoH) as a meaningful proxy at the individual level—enhancing precision in population health efforts, risk stratification, and targeted interventions.
PCCI’s CVC also serves as the backbone for the United Way of Metropolitan Dallas’ Data Capacity Building Initiative (DCBI), which is helping hundreds of organizations in North Texas turn insights into impact. The DCBI initiative has shown how the CVC is scalable and usable outside traditional healthcare settings. For instance, one CBO is using the CVC’s block group data to understand more about residents’ situations and tailor services more prescriptively. One organization has become better positioned to help victims and their children get out of harm’s way using the CVC, while another CBO is using the data to confirm service overuse in certain neighborhoods and service deserts in others.
An underlying goal for PCCI is to leverage the CVC to create a standard language and shared understanding around how NMDoH is utilized in Dallas County and beyond. This shared understanding would allow CBOs, governmental and healthcare providers to collaborate around a shared language of data in a more efficient manner.
Above all, the CVC fosters collaboration among diverse stakeholders by creating a shared understanding of community vulnerabilities and empowering organizations to advocate for and implement policy changes that address systemic issues. By addressing both health and overall equity, the CVC empowers safety-net hospitals and clinics serving vulnerable populations, funders, and CBOs to develop comprehensive strategies that enhance access to essential services, improve health outcomes, and ultimately promote social justice. In doing so, the CVC serves as a critical tool in advancing health equity, driving policy change to break cyclical inequity, and addressing systemic issues that impact the well-being of individuals and communities.
Learn more about the development of the CVC in PCCI’s recent publication in JAMIA which highlights how the CVC elevates insights and expands on the performance of existing tools that measure community socioeconomic variation.
Lance Rather is the Senior Director of Product and Strategic Partnerships at PCCI. At PCCI he leverages his extensive expertise in technology and data analytics to develop and refine health-related products. Lance plays a crucial role in the creation and enhancement of tools like the Community Vulnerability Compass (CVC), focusing on making complex data accessible and actionable for healthcare providers and policymakers.
By Jacqueline Naeem, MD, Vice President of Clinical and Social Health, PCCI
During the last decade, we have seen major breakthroughs in preventing HIV infection. However, even with these advances, the infection rate has not appreciably dropped1. Pre-exposure prophylaxis (PrEP) has emerged as a highly effective preventive strategy for HIV, reducing the risk of HIV infection by up to 99% when taken consistently. Due to its effectiveness, the CDC recommends2,3 that medical providers counsel and prescribe PrEP to all sexually active patients if they are at risk for HIV infection. However, despite its efficacy, PrEP remains underutilized, in large part due to lack of awareness. This is where artificial intelligence (AI) has stepped in to significantly advance our HIV prevention efforts.
Despite improvements in morbidity and mortality associated with HIV due to antiretroviral therapy, and the availability of an effective preventative medication, the incidence of HIV has only modestly decreased, with a 9% decrease between 2015 and 2019 and total of 36,136 cases in 2021. In Dallas County4, we find a situation that is almost at crisis levels with the spread of sexually transmitted infections (STI), including HIV. For example, Dallas County ranks 2nd highest in HIV, 6th in Syphilis, 21st in Gonorrhea, and 26th in Chlamydia infection rates compared to the other 254 Texas counties. With its position as North Texas’s largest safety-net hospital system, Parkland Health (Parkland) serves an extensive population of at-risk patients, creating a vital opportunity to enhance HIV testing and facilitate connections to PrEP programs.
Although we knew the mission was clear, the challenge was also great. We have an effective preventive treatment— PrEP, and opportunities to reach PrEP candidates—through Parkland, but what we were lacking was a way to identify candidates for referral in a simple way that could be incorporated into Parkland’s workflows and be paired with provider tools to guide discussion and assessment of indications and eligibility criteria for PrEP. To address this critical gap, we developed and implemented a predictive model, PCCI’s HIV Detection AI/ML Model, informed by EHR data and paired with provider tools to guide discussions on PrEP eligibility criteria, to efficiently identify (and target for outreach) individuals who stand to benefit most from PrEP.
PCCI’s HIV Detection AI/ML Model project work began in the latter part of 2020. Once underway, we then worked with Parkland’s IT to integrate the developed model for provider alert-based, risk-stratified interventions, in silent mode. We then automated PrEP Model load to the Parkland test table for piloting and testing the workflow. We also identified the patient population cohort eligible for HIV risk scoring. In late 2022, the model went live, using information from the EHR to predict the individuals at increased likelihood of acquiring HIV and who may be candidates for HIV PrEP. Once identified, the patients can be offered HIV testing, and if negative can be offered PrEP. So far, the HIV Detection AI/ML Model has risk stratified hundreds of thousands of patients, demonstrating that machine learning models can be used for predicting and classifying the risk of HIV using available EHR data.
We see this as a breakthrough for identifying candidates who are at risk for HIV infection. PCCI’s HIV Detection AI/ML Model has been shown to effectively address the needs of vulnerable populations and can be implemented in hospital settings with limited resources. There are opportunities to expand this model to reach even more patients in Dallas County, through an additional project underway with Dallas County Health and Human Services.
We revealed the methods and results of PCCI’s HIV Detection AI/ML Model in three peer-reviewed papers released in the past year:
AJPM Focus
Supporting Access to HIV Pre-Exposure Prophylaxis in a Shifting Financial and Insurance Landscape
Leveraging predictive models within Parkland and Dallas County allows providers to identify individuals at high risk for HIV acquisition and those who are prime candidates for PrEP. By doing so, we can implement proactive interventions that can bridge critical gaps in the HIV prevention cascade, thereby contributing to the broader goal of reducing HIV incidence in Dallas County.
About the Author
Naeem, MD, is Vice President of Clinical and Social Health at PCCI. She is a graduate of the University of Manchester Medical School, Manchester, England, where she also obtained her post-graduate diploma in Psychiatry at the University of Manchester. She undertook postgraduate training in both psychiatry and general practice also in the UK, as well as working as a medical school examiner. Since joining PCCI, Dr. Naeem has used her clinical experience and unique insights in several projects, particularly those with an emphasis on Non-Medical Drivers of Health and also mental behavioral projects. Dr. Naeem was also the program leader for the U.S. Centers for Medicare & Medicaid Services (CMS) Accountable Health Communities (AHC) Model in Dallas County.
###
1. Centers for Disease Control and Prevention. Diagnoses of HIV infection in the United States and dependent areas, 2021. HIV surveillance report 2023; 34. Published May 23, 2023. Accessed January 22, 2024.
2. US Preventive Services Task Force. Preexposure prophylaxis for the prevention of HIV infection: US preventive services Task Force recommendation statement. JAMA. 2019;321:2203–2213.
4. Dallas County Health and Human Services. 2017 profile of HIV in Dallas County. Published August 14, 2018. Available at: https://www.dallascounty.org/Assets/uploads/docs/hhs/epistats/HIVSTIProfiles2017.pdf. Accessed January 30, 2024.
In the News: How We Are Fighting HIV Infection Using AI
Recently, Healthcare IT Today posted a column written by by Jacqueline Naeem, MD, Vice President of Clinical and Social Health at PCCI, where she discusses how PCCI developed an AI-driven model that helps identify candidates who for preventative HIV measures.
If you are leading efforts to improve and understand public health in your community, we’ve researched and validated that PCCI’s Community Vulnerability Compass (CVC) offers an improvement in advanced insights and performance compared to existing tools that measure community socioeconomic conditions in our neighborhoods. Although getting here took a lot of innovation and perseverance, through a recent publication, we are now able to share what factors differentiate the CVC and why it offers the gold-standard of social determinants of health (SDOH) measurement.
In research published in JAMIA Open, through Oxford University Press’ platform, we detailed how the CVC can help lead the way in measuring community SDOH, while also offering deeper, hyper-localized insights unavailable anywhere else.
CVC provides a unique methodology embedded into an interactive dashboard that helps stakeholders—including community-based organizations (CBOs), safety-net hospitals, health systems, philanthropic organizations, governmental agencies, universities, and Managed Care Organizations (MCOs)—to make data-driven decisions that enhance health outcomes and drive equity in service delivery.
The CVC’s unique value proposition offers one-of-a-kind insights where it analyzes, at the ZIP Code, census tract, and block-group level, where a community’s most vulnerable residents live and the root cause factors limiting these residents’ ability to thrive. The CVC analyzes 26 clinical and socio-economic indicators that reveal the health, resiliency, and economic vibrancy of neighborhoods. CVC’s analyses provide true, holistic pictures of who needs the most assistance and where to find them, enabling proactive support of those in need.
Though the CVC offers an impressive set of features, as public health leaders, we have choices. There are many available tools we can use to better understand our communities and their social conditions. That is where CVC sets itself apart. It offers localized data to our partners or customers catchment area, not just generalized, large geographical regions. It shows— to the block group — what the social conditions are and the root causes of those conditions.
For example, our research reflected the differences between CVC and the Area Deprivation Index [ADI], Social Vulnerability Index [SVI], and Environmental Justice Index [EJI]). As presented in the article, the CVC’s Community Vulnerability Index (CVI), and 4 sub indexes, were used to classify all 18,638 Texas census-block groups as Very-High, High, Moderate, Low, and Very-Low social vulnerability. Individual patients were then assigned the vulnerability classification of their home address census-block group, creating a bridge between neighborhood-level data and individual-level health insights. CVC’s classifications were compared against three existing community vulnerability tools and validated against individual-level SDOH screening tools or Z-code documentation, but where we clearly separate ourselves from the others is we localize data to our partners or customers catchment area. Spearman rank correlation was used for neighborhood-level comparisons and precision/recall, for individual-level comparisons.
Let’s look at what each of these different systems offer and how we differ in features and performance.
Area Deprivation Index (ADI)
What the ADI Provides: The ADI is a composite measure that uses U.S. Census data to assess socioeconomic disadvantage at a neighborhood level. It provides valuable insights for healthcare providers and policymakers to understand and address health disparities.
CVC Difference: While ADI focuses on socioeconomic disadvantage, CVC goes beyond this by integrating various medical and non-medical determinants of health (NMDoH) indicators to provide actionable insights at the block-group level. CVC provides key insights to strengthen local interventions, empowering both health systems and CBOs to implement strategies directly targeting specific vulnerabilities in their communities.
The Social Vulnerability Index (SVI)
What The SVI Provides: Developed by the CDC, the SVI measures community resilience to external stresses using various social factors. It is commonly used for disaster preparedness and resource allocation.
CVC Difference: While SVI provides valuable data at a census tract level, CVC offers block-group-level insights, allowing for more precise targeting of interventions. CVC focuses on actionable data for public health departments, health systems, and CBOs, empowering them to engage effectively with vulnerable populations.
Environmental Justice Index (EJI)
What The EJI Provides: The EJI assesses the environmental and health burdens faced by disadvantaged communities. It focuses on exposure to environmental hazards, considering factors like pollution and access to green spaces, to identify areas at risk.
CVC Difference: CVC complements the EJI by not only focusing on environmental factors but also incorporating social vulnerabilities that contribute to overall health disparities. This broader perspective allows CVC to provide a more comprehensive understanding of community needs, facilitating targeted interventions that address factors: health, environment, and NMDoH.
In the research presented in the JAMIA paper, we see that overall, the CVC was comparable to, or outperformed, existing neighborhood indexes in measuring key SDOH at both the neighborhood and individual level. CVC showed a strong correlation with existing SDOH indexes from the ADI, SVI, and EJI across multiple social risk domains, demonstrating its ability to identify a cross-cutting range of social vulnerabilities and community equity markers. Additionally, CVC had very good recall rates for individual-level SDOH, both when validated against Z-code documentation and against self-reported survey tools (>75%).
This table, developed for the JAMIA paper, tells the full comparison article1:
Community Vulnerability Index (CVI) and CVC Subindexes Recall and Precision Rates for Self-Reported Social Determinants of Health (SDOH) Using Surveys.
SDOH
Community Vulnerability Index
Empowered People Subindex
Equitable Communities Subindex
Good Health Subindex
Household Essentials Subindex
Precision (%)
Recall (%)
Precision (%)
Recall (%)
Precision (%)
Recall (%)
Precision (%)
Recall (%)
Precision (%)
Recall (%)
Food Need
75.1
77.5
75.1
73.4
74.6
55.3
75.1
72.9
75.4
74.4
Housing Need
36.9
78.6
36.4
73.4
39.1
59.8
37.3
74.7
36.3
73.9
Safety Need
1.2
79.6
1.0
66.0
1.2
56.3
1.3
81.6
1.1
70.9
Transportation Need
31.9
79.3
31.9
75.2
33.5
59.9
32.5
76.0
31.8
75.7
Utility Need
42.6
77.0
42.7
73.2
41.4
53.7
42.3
71.8
42.8
74.0
For each CVC Index/Sub-index, the highest values of precision/recall are highlighted in green and the lowest in blue; CVC: Community Vulnerability Compass.
PCCI’s CVC has been incorporated into a variety of use cases and settings throughout Texas, including adoption by the Dallas County Department of Health & Human Services, the University Heath (San Antonio) Transplant Center and serves as the backbone for the United Way of Metropolitan Dallas’ Data Capacity Building Initiative, which is helping hundreds of organizations in North Texas turn insights into impact.
As a member of the public health community, I am excited to see how we can use the CVC to better understand the true health of our communities and the contributing root causes. The research we presented in the JAMIA paper is so important to me as it shows clearly how the CVC can give me insights unavailable through any other means.
The thought-provoking results we are seeing gives our public health leaders a trusted new technology that will enable the delivery of more precise approaches to address the needs of those most at-risk in our communities.
About Yolande Pengetnze
Yolande Pengetnze, MD, MS, FAAP, is PCCI’s Senior Vice President of Clinical Leadership where she leads multiple projects including population health quality improvement projects focusing on preterm birth prevention and pediatric asthma at the individual and the population level. Dr. Pengetnze received her MD from the University of Yaounde in Cameroon and completed a Pediatric Residency at Maimonides Medical Center in New York. She was a faculty member at UTSW’s General Pediatric Hospitalist Division where she completed a General Pediatric/Health Services Research Fellowship training and earned a Master of Sciences in Clinical Sciences.
###
1 Oxford Academic – JAMIA Open Journal, Published July 2025, The Community Vulnerability Compass: a novel, scalable approach for measuring and visualizing social determinants of health insights, https://doi.org/10.1093/jamiaopen/ooaf059
VIDEO: PCCI‘s Sachs Summer Scholars Innovation Showcase for 2025
This year’s class of PCCI’s Sachs Summer Scholars have spent this term working closely with PCCI’s data scientists and clinical leaders on programs that have real impact. They have also had a chance to witness Parkland Health and Parkland Community Health Plan programs to help them understand their contributions serving vulnerable communities. They’ve also had a lot of fun along their journey.
The Innovation Showcase video shows how the interns took on the opportunity to explore some of PCCI’s most forward-thinking initiatives. These talented interns presented their work on high impact PCCI projects focused on innovative healthcare, groundbreaking artificial intelligence programs, and non-medical drivers of health projects.
PCCI’s Sachs Summer Scholars is an internship program that demonstrates PCCI’s ongoing commitment to provide women opportunities to experience new, transformational concepts in the data science and health technology industry.
The Innovation Showcase spotlights the work of PCCI’s elite group of intern’s experiences working on innovative healthcare, groundbreaking artificial intelligence programs, and non-medical drivers of health projects such as preterm birth prevention, large language models, digital engagement scoring, and suicide risk modeling, to name a few.
As one of the top data science and technology-focused internships in North Texas, PCCI’s program immerses students in meaningful, real-world projects with actual impact through practical applications of analytics, computing, and data science, all while advancing the spirit of mentorship and advancement of female students.
For a full overview of this year’s class, go to: https://pccinnovation.org/pcciscd1-sachs-summer-scholars-interns-set-to-advance-ai-innovations-for-vulnerable-populations/
Please mark your calendar for this event and I look forward to seeing you there!
JAMIA Open Journal Examines PCCI’s Community Vulnerability Compass That Sets New Standard for Measuring Social Determinants of Health
JAMIA, through Oxford University Press’ platform, recently published and distributed an in-depth paper authored by Parkland Center for Clinical Innovation (PCCI), detailing how PCCI’s innovative Community Vulnerability Compass (CVC) elevates insights and performance of existing tools that measure community socioeconomic variation.
PCCI has achieved a significant breakthrough in addressing one of healthcare’s most pressing challenges: accurately identifying and measuring social determinants of health (SDOH) at scale. A cross-sectional study to build the CVC (2018-2023) and validate it (September 2023 to June 2024) was revealed in groundbreaking research published in JAMIA Open, a prestigious single-blind peer-reviewed, Gold Open Access journal that serves as a global forum for cutting-edge research in biomedical and health informatics. This publication demonstrates that PCCI’s CVC outperforms existing tools in measuring both neighborhood and individual-level social vulnerabilities.
Written by PCCI’s clinical and data science experts, the JAMIA article offers a comprehensive look at what tools are available to evaluate community SDOH elements, how the CVC tool works as well as the process and methods PCCI used to make head-to-head comparisons with other currently available tools.
As presented in the article, the CVC’s Community Vulnerability Index (CVI), and 4 subindexes were used to classify all 18,638 Texas census-block groups as Very-High, High, Moderate, Low, and Very-Low social vulnerability. Individual patients are then assigned the vulnerability classification of their home address census-block group, creating a bridge between neighborhood-level data and individual-level health insights. CVC’s classifications were compared against three existing community vulnerability tools, including Area Deprivation Index [ADI], Social Vulnerability Index [SVI], and Environmental Justice Index [EJI]) and validated against individual-level SDOH screening tools or Z-code documentation. Spearman rank correlation was used for neighborhood-level comparisons and precision/recall, for individual-level comparisons.
The paper shows that overall, the CVC was comparable to or outperformed existing neighborhood indexes in measuring key SDOH at both the neighborhood and individual level. CVC showed a strong correlation with existing SDOH indexes (ADI, SVI, and EJI) across multiple social risk domains, demonstrating its ability to identify a cross-cutting range of social vulnerabilities and community equity markers. Additionally, CVC had very good recall rates for individual-level SDOH both when validated against Z-code documentation and against self-reported survey tools (>75%).
“This paper summarizes countless hours of research and development that culminated in creating an industry leading SDOH measurement tool that has the potential and momentum to become the gold standard,” said Steve Miff, PhD, President and CEO of PCCI. “The data and information presented in the paper offers a fully transparent look into how the CVC works and its ability to surface hyper-localized insights that is novel and unique. We are very proud of achieving this key milestone and expanding of how the CVC can support communities and population health in ways that have previously been out of reach.”
The JAMIA article, co-authored by PCCI’s Yolande Pengetnze, MD, MS, Yusuf Tamer, PhD, Lance Rather, BS, and others, provided strong evidence of the benefit of gaining contextual understanding of social barriers to health in the individual’s micro-ecosystem.
“The JAMIA article digs deep into our approach and the steps we took to test how addressing social determinants at the block group level helps address specific needs and health of vulnerable populations,” said Yolande Pengetnze, MD, MS, PCCI’s Senior Vice President of Clinical Leadership. “This article shows clear, thought-provoking results that can equip public health leaders with a trusted tool enabling new methods of addressing the needs of those most at-risk in our communities.”
PCCI’s CVC analyzes, at the ZIP Code, census tract, and block-group level, where a community’s most vulnerable residents live and the root cause factors limiting these residents’ ability to thrive. The CVC analyzes 26 clinical and socio-economic indicators that reveal the health, resiliency, and economic vibrancy of neighborhoods. CVC’s analyses provide true, holistic pictures of who needs the most assistance and where to find them, enabling proactive support of those in need.
“This paper offers proof of the viability and potency of the CVC,” said Lance Rather, PCCI’s Senior Director, Product & Strategic Partnerships. “The paper offers clear evidence of how the CVC can provide data previously unavailable at the neighborhood level. Organizations that have implemented the CVC have discovered how rapidly and intuitively it transforms complex social vulnerability data into actionable insights that substantially advance their core missions. The use of the CVC can be applied in so many ways by different organizations, and we are excited at the possibilities that lay ahead.”
About PCCI
The Parkland Center for Clinical Innovation (PCCI) is a not-for-profit, mission-driven organization with industry-leading expertise in the responsible application of artificial intelligence, machine learning and non-medical drivers of health data modeling to address the needs of vulnerable populations. PCCI started as a department within Parkland Health and was spun out as an independent organization in 2012. PCCI strives to leapfrog the status quo by harnessing the transformative potential of data. Our unique capabilities allow us to provide innovative, actionable solutions that more effectively identify needs, prioritize services, empower providers, and engage patients.
JAMIA Open, a peer-reviewed journal from Oxford Academic Press, publishes a paper on PCCI’s Community Vulnerability Compass (CVC)
In a paper titled “The Community Vulnerability Compass: a novel, scalable approach for measuring and visualizing social determinants of health insights,” PCCI authors give a deep look at how the CVC is developed and deployed to create an accurate and scalable social determinants digital measurement tool that shows the true vulnerabilities residents face across our communities.
“This paper highlights the power of the CVC that gives us the ability to surface block-level insights allowing us to understand at scale the true nature and shared characteristics of critical non-medical vulnerabilities. This gives community and health leaders heightened, hyper-localized understanding of their neighborhoods they serve to create sustainable, customized solutions to support their health and wellness journey.”